
Infoboards
Infoboards transform data into impactful visualizations and compelling stories. They empower businesses to communicate their data clearly and effectively. Infoboards cater to a wide range of industries, offering tailored visualizations that address unique business needs with its industry-specific and customizable templates.
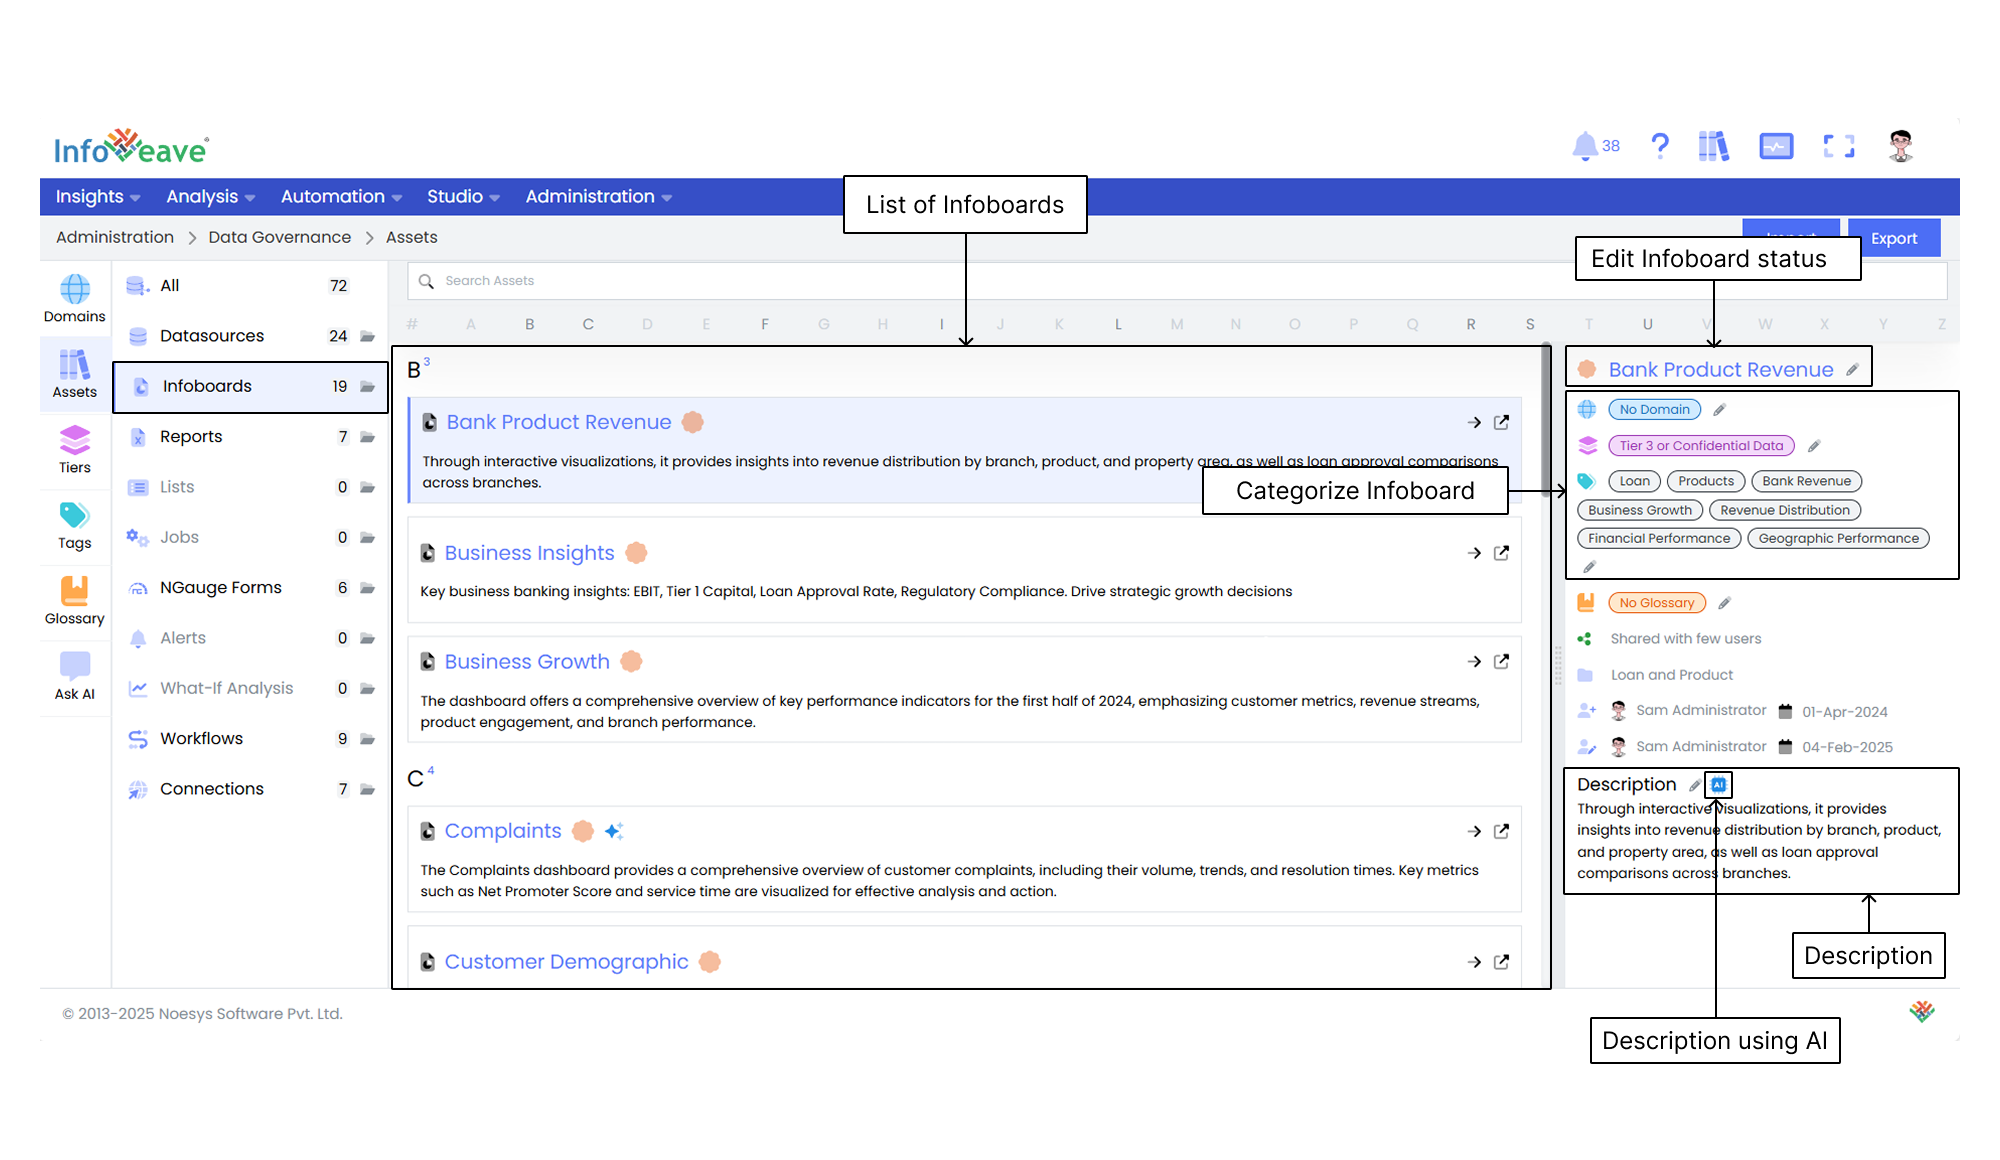
Editing the Infoboard status Click the pencil icon next to an Infoboard name to choose whether the Infoboard is verified or not verified.
Categorizing Infoboards Assign specific domains, tiers, tags, and glossary terms to help organize and classify the Infoboards.
Managing the Sharing status View whether an Infoboard is shared or not shared to manage access permissions.
Tracking Infoboard Updates View information such as created by and updated by, along with the respective dates. This ensures transparency and supports version tracking.
Editing the Description You can either manually edit the description of an Infoboard or generate it automatically using AI for streamlined content creation.
Documentation

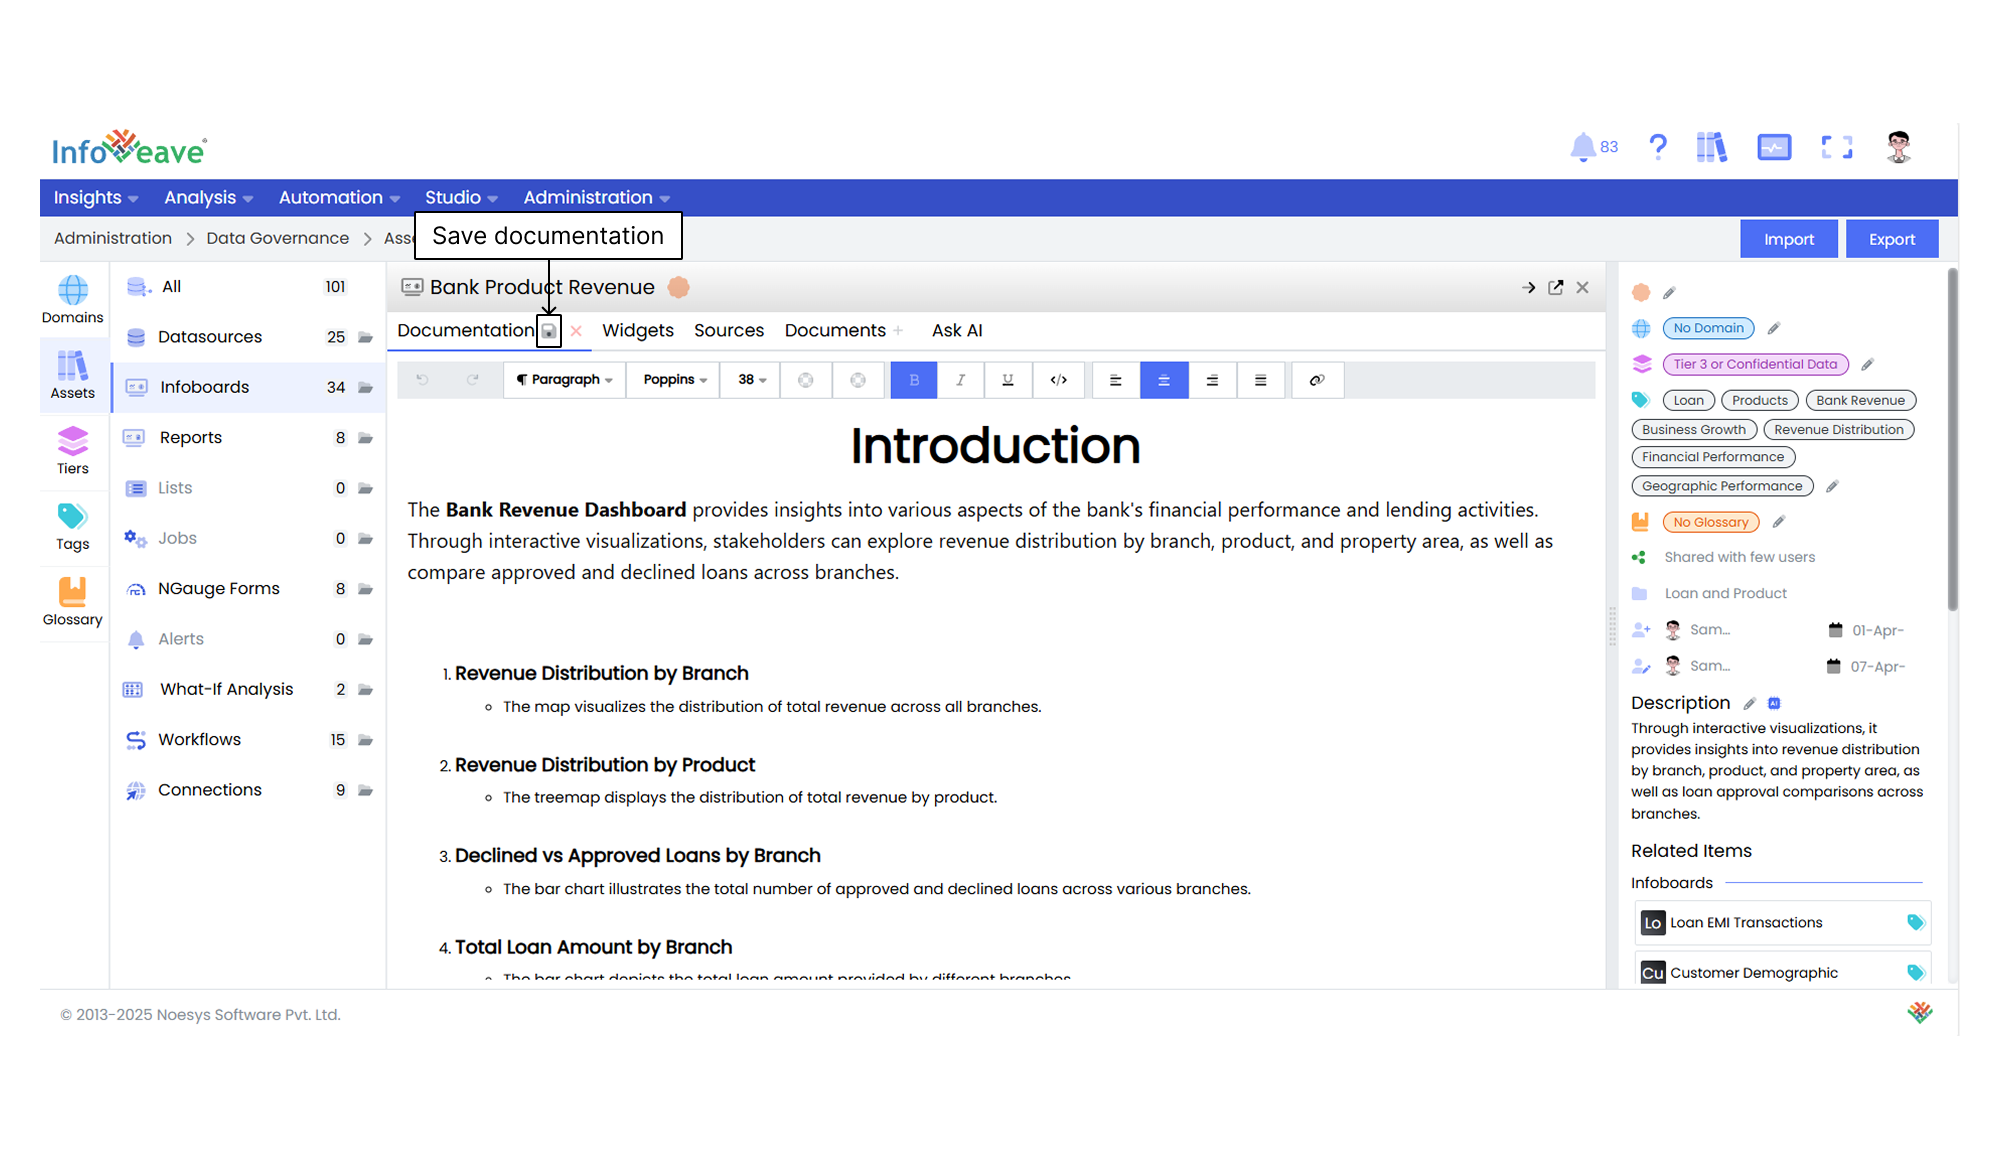
After clicking the New documentation button, you can compose your documentation in the provided editor. Once completed, click the Save icon to store the documentation.
Widgets
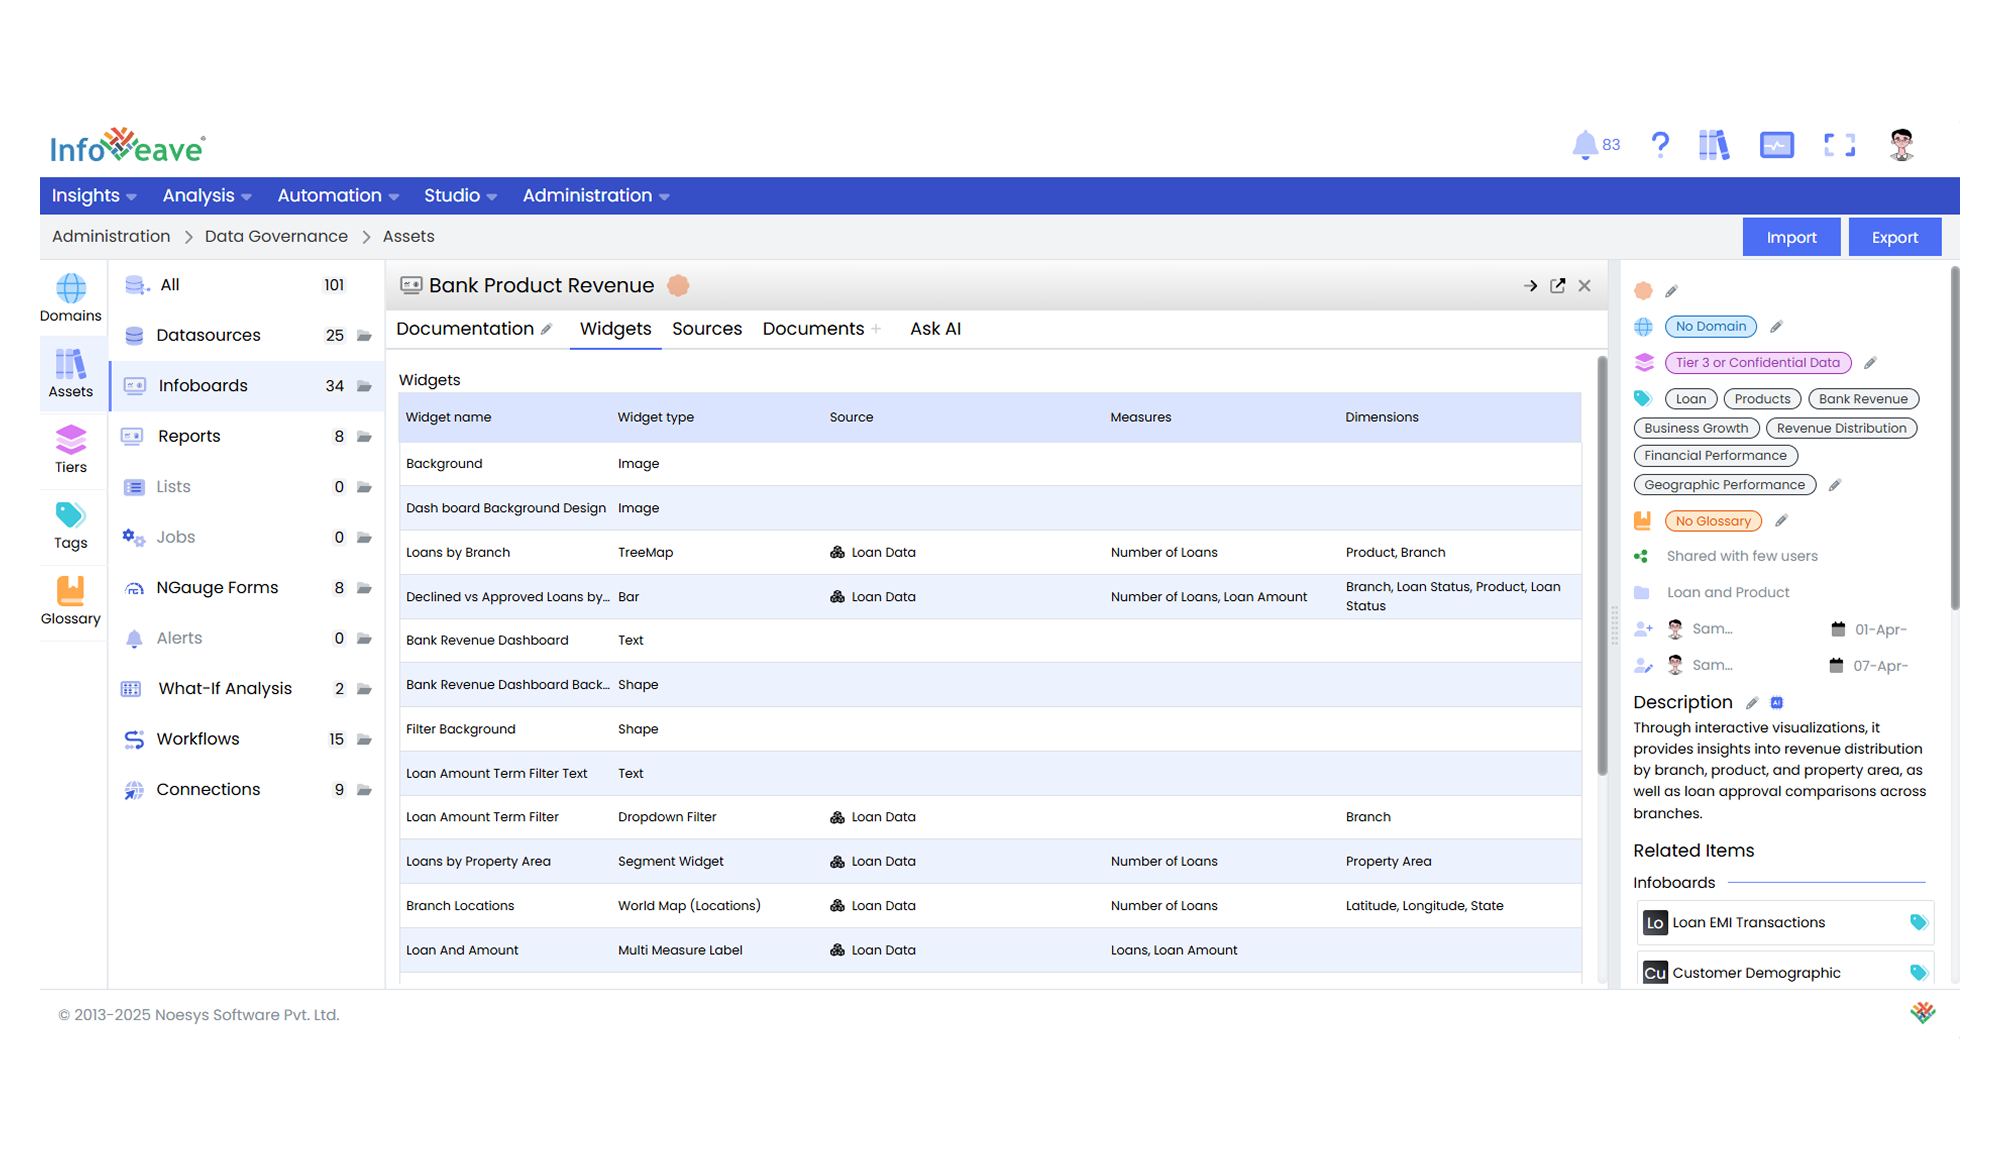
Here is a breakdown of the key aspects of widgets.
Widget name Identifies the specific widget being used.
Widget type Specifies the format or design of the widget (for example, Image, Bar, TreeMap, or Shape).
Source Links the widget to its Datasource, such as Loan Data or other relevant datasets.
Measures Describes the quantitative data being displayed, like Number of Loans or Loan Amount.
Dimensions Lists the key dimensions or categories by which the data is segmented, such as Branch, Product, Loan Status, and State.
Each widget in the Infoboard is tailored to provide insights based on its respective data. It helps you visualize key metrics and KPIs in a meaningful way. The configuration of each widget can include elements like charts, maps, and filters, ensuring you have a flexible and comprehensive view of the data.
Sources
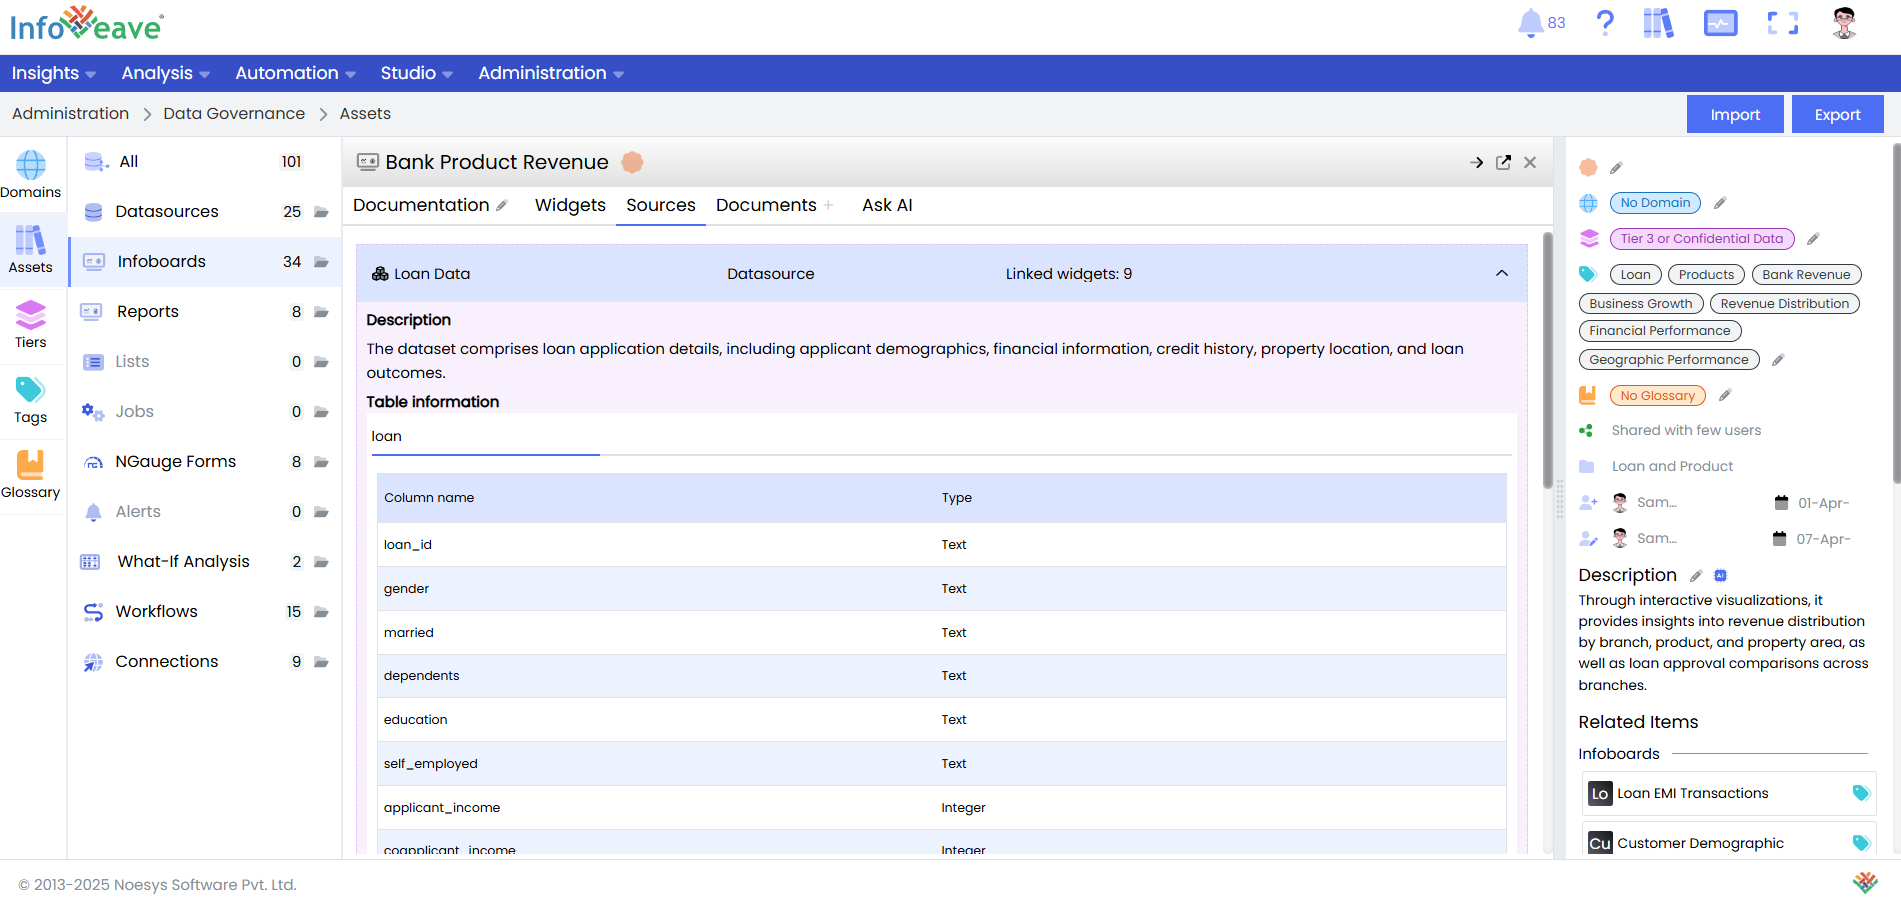
In the Sources section of the Infoboard, the system displays the various Datasources linked to each Infoboard. When you select a Datasource, the system shows detailed information about that source.
This includes the following.
Description A brief overview or additional context regarding the Datasource.
Table Information Detailed metadata for the Datasource, including the column names and their respective types.
Linked Widgets Information about how many widgets are linked to the Datasource. This indicates how the data is being used within the Infoboard for reporting or visualization purposes.
This functionality gives you a clear understanding of the structure and properties of the data. It helps ensure accurate reporting and streamlines data integration within the system.
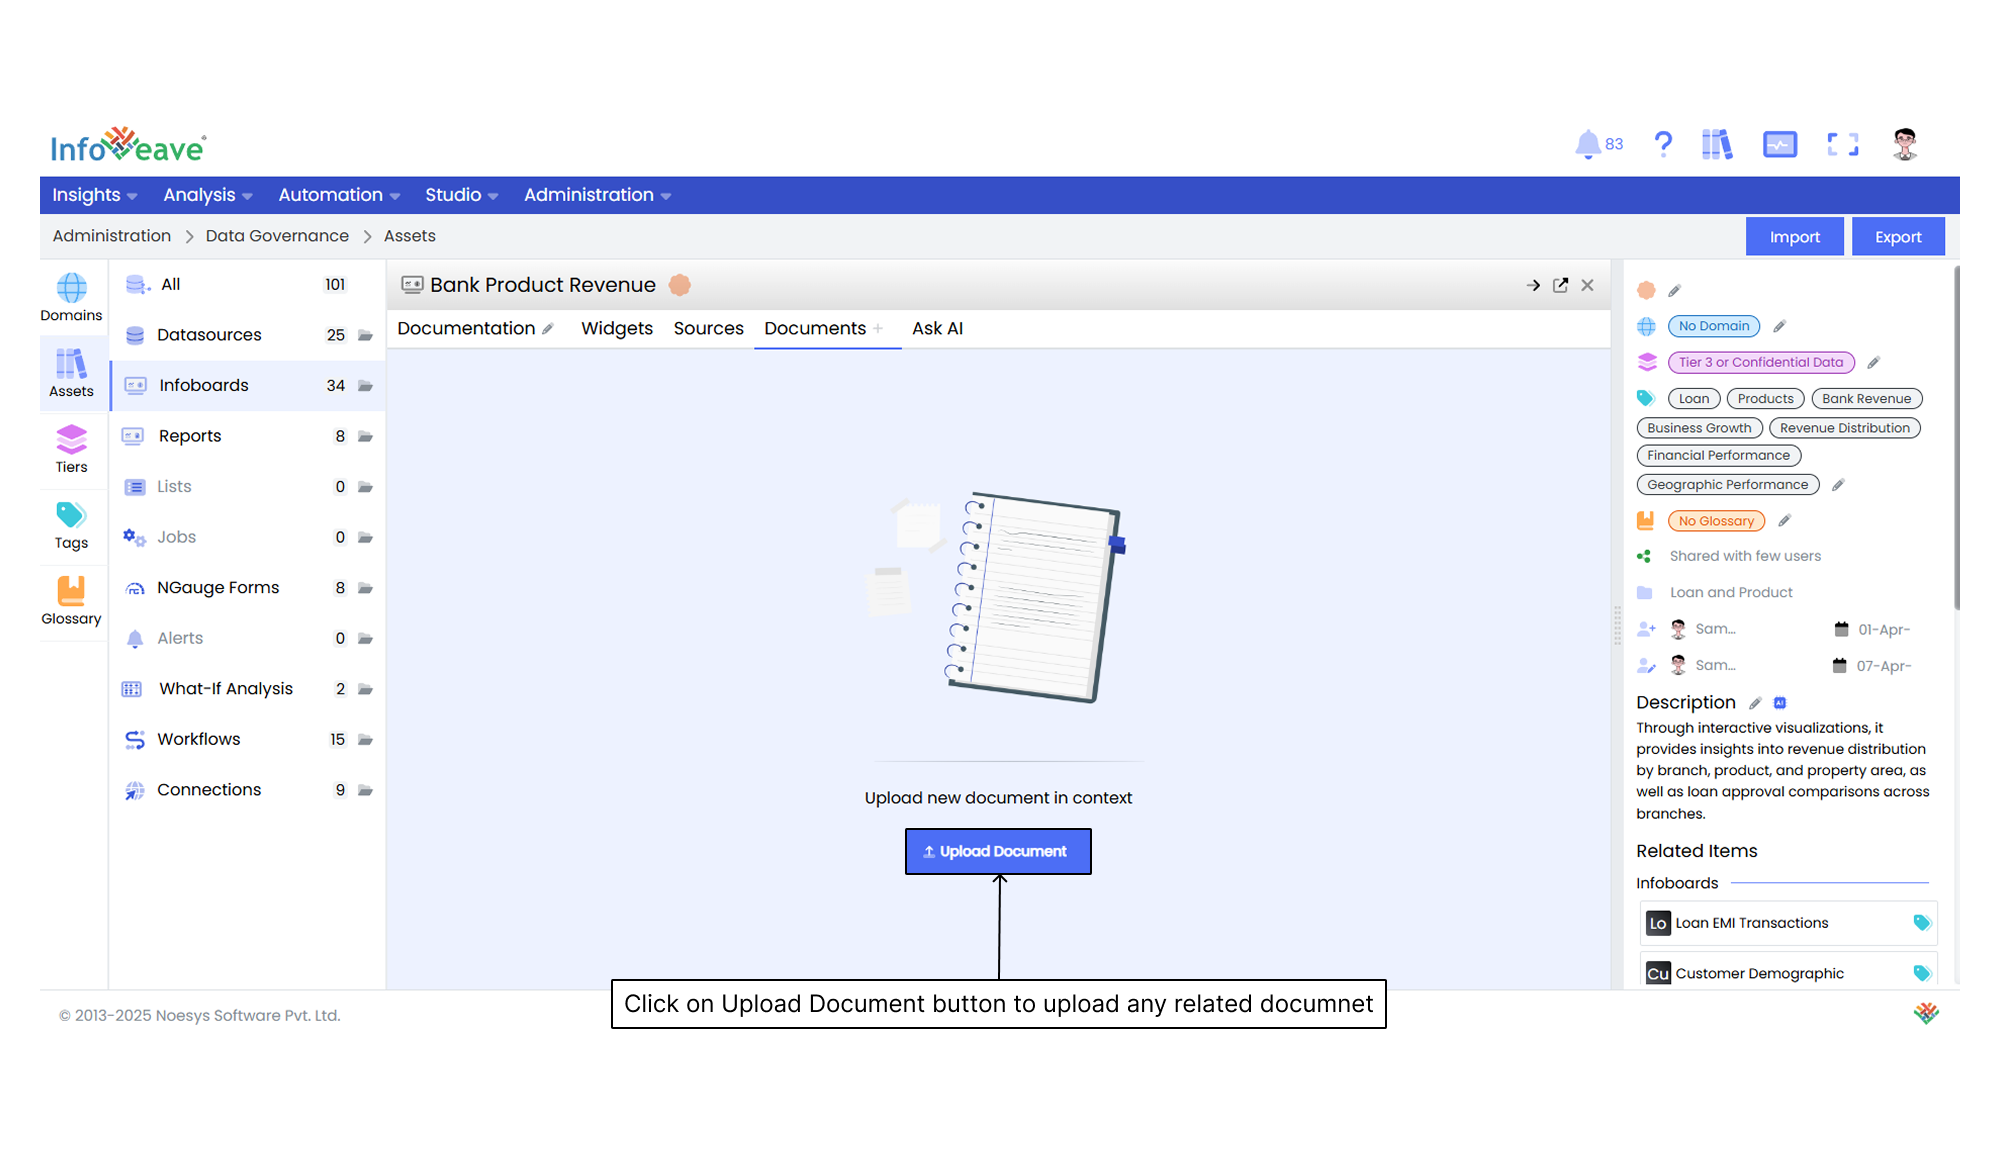
Documents
Using Ask AI
Ask AI enables you to get instant answers to any questions related to a specific asset. It provides quick and context-aware insights to improve understanding and support decision-making. It uses the available documentation to respond to your queries. If a document is uploaded in the Documents section, it is automatically made available in the Ask AI chat. This allows the assistant to reference it while generating responses.