---
title: Manage Reports in Infoveave
description: Reports
---
import { Aside } from '@astrojs/starlight/components';
# Reports
In Infoveave, a report is a structured document that presents data and insights in a formatted manner. It provides a concise summary of data analysis. It often includes visualizations such as charts and tables. Reports in Infoveave help you communicate data-driven insights effectively. They support informed decision-making processes.
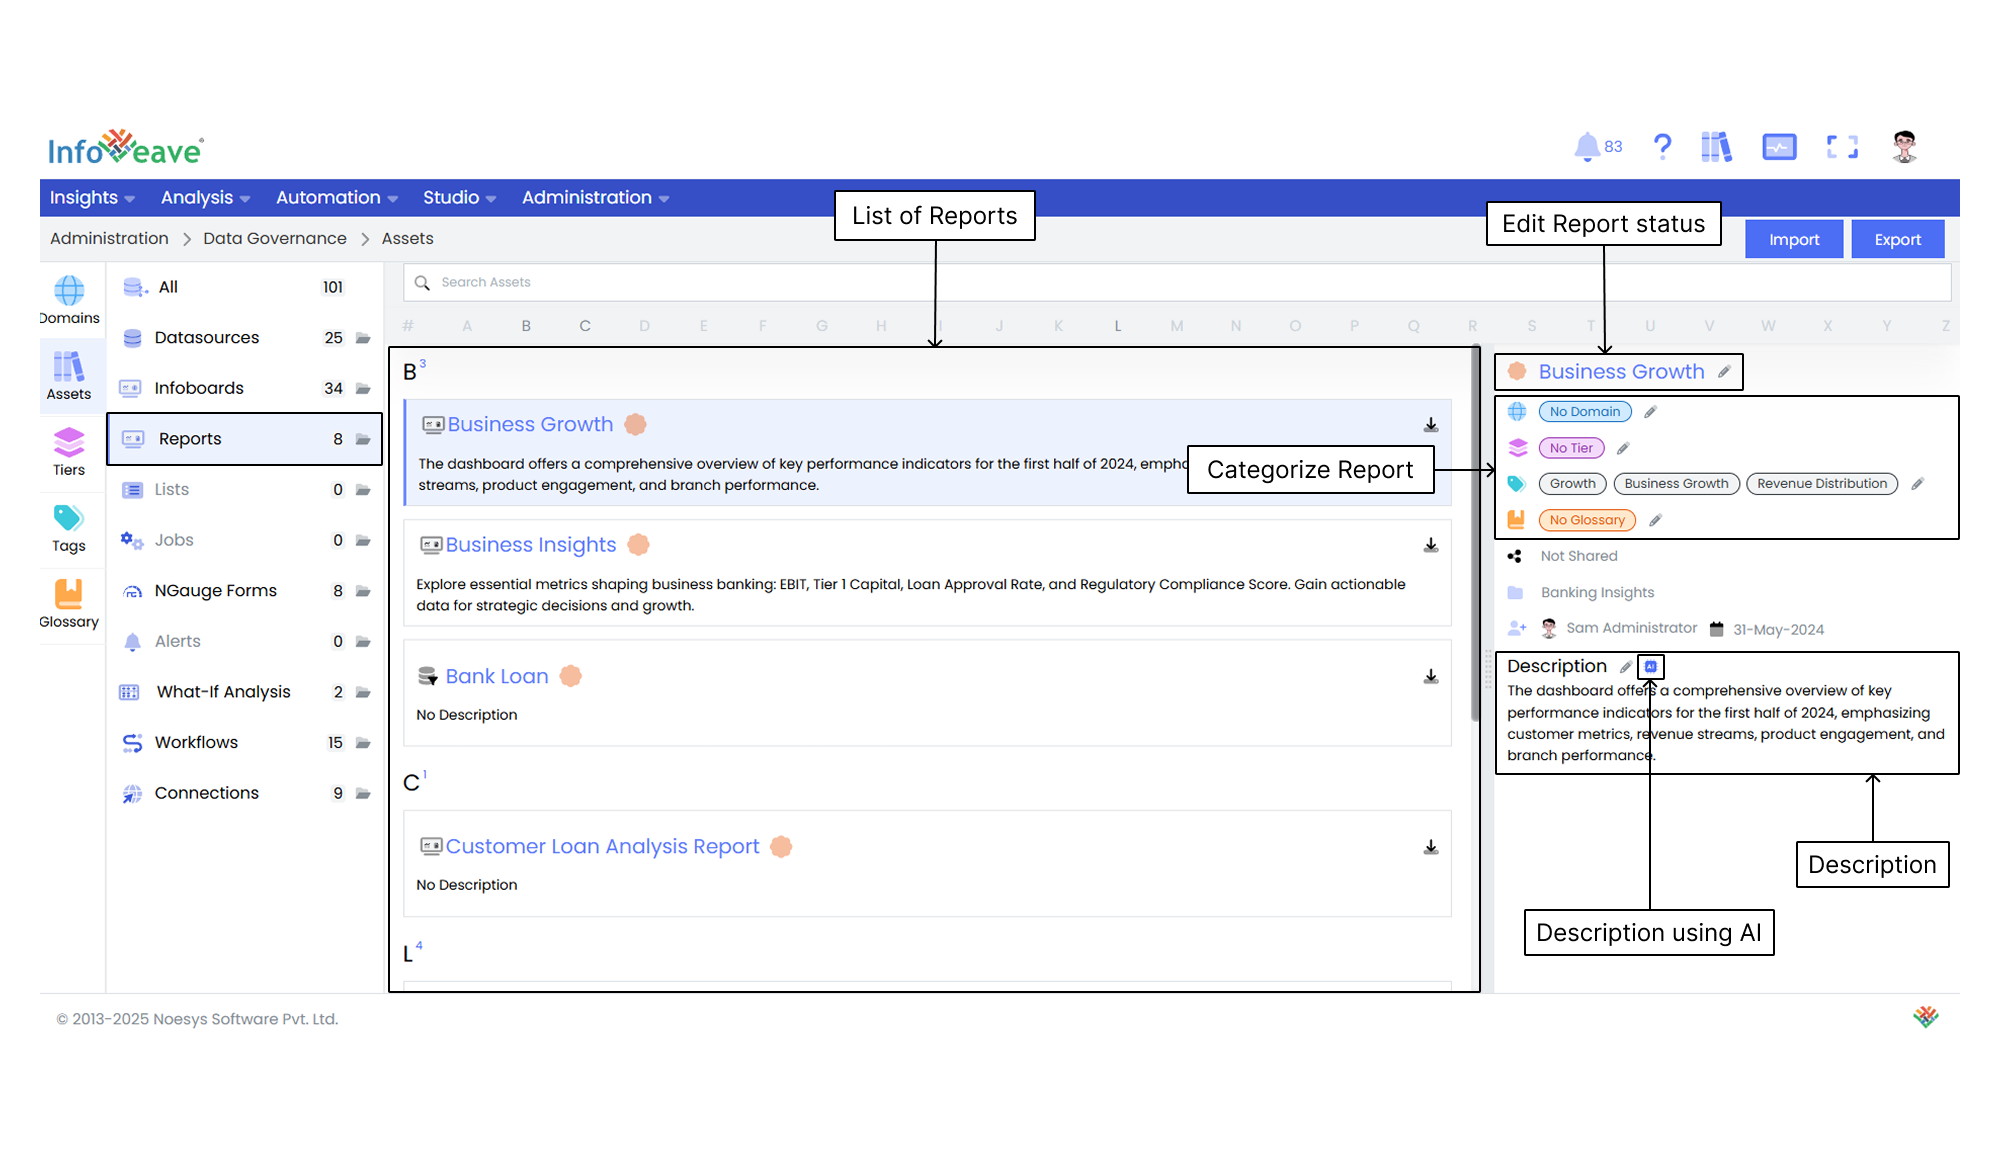
**Edit Report status** Click the pencil icon next to a report name to select whether the report is **verified** or **not verified**.
**Categorize the Report** Assign specific **domains**, **tiers**, **tags**, and **glossary** terms to help you organize and classify the reports.
**Manage Sharing status** View whether a report is **shared** or **not shared** to manage its access permissions.
**Track Report Updates** View information such as **created by** and **updated by**, along with the respective dates. This helps ensure transparency and accurate version tracking.
**Edit the Description** You can either manually **edit** the description of a report or generate it automatically using **AI** for more streamlined content creation.
## Documentation
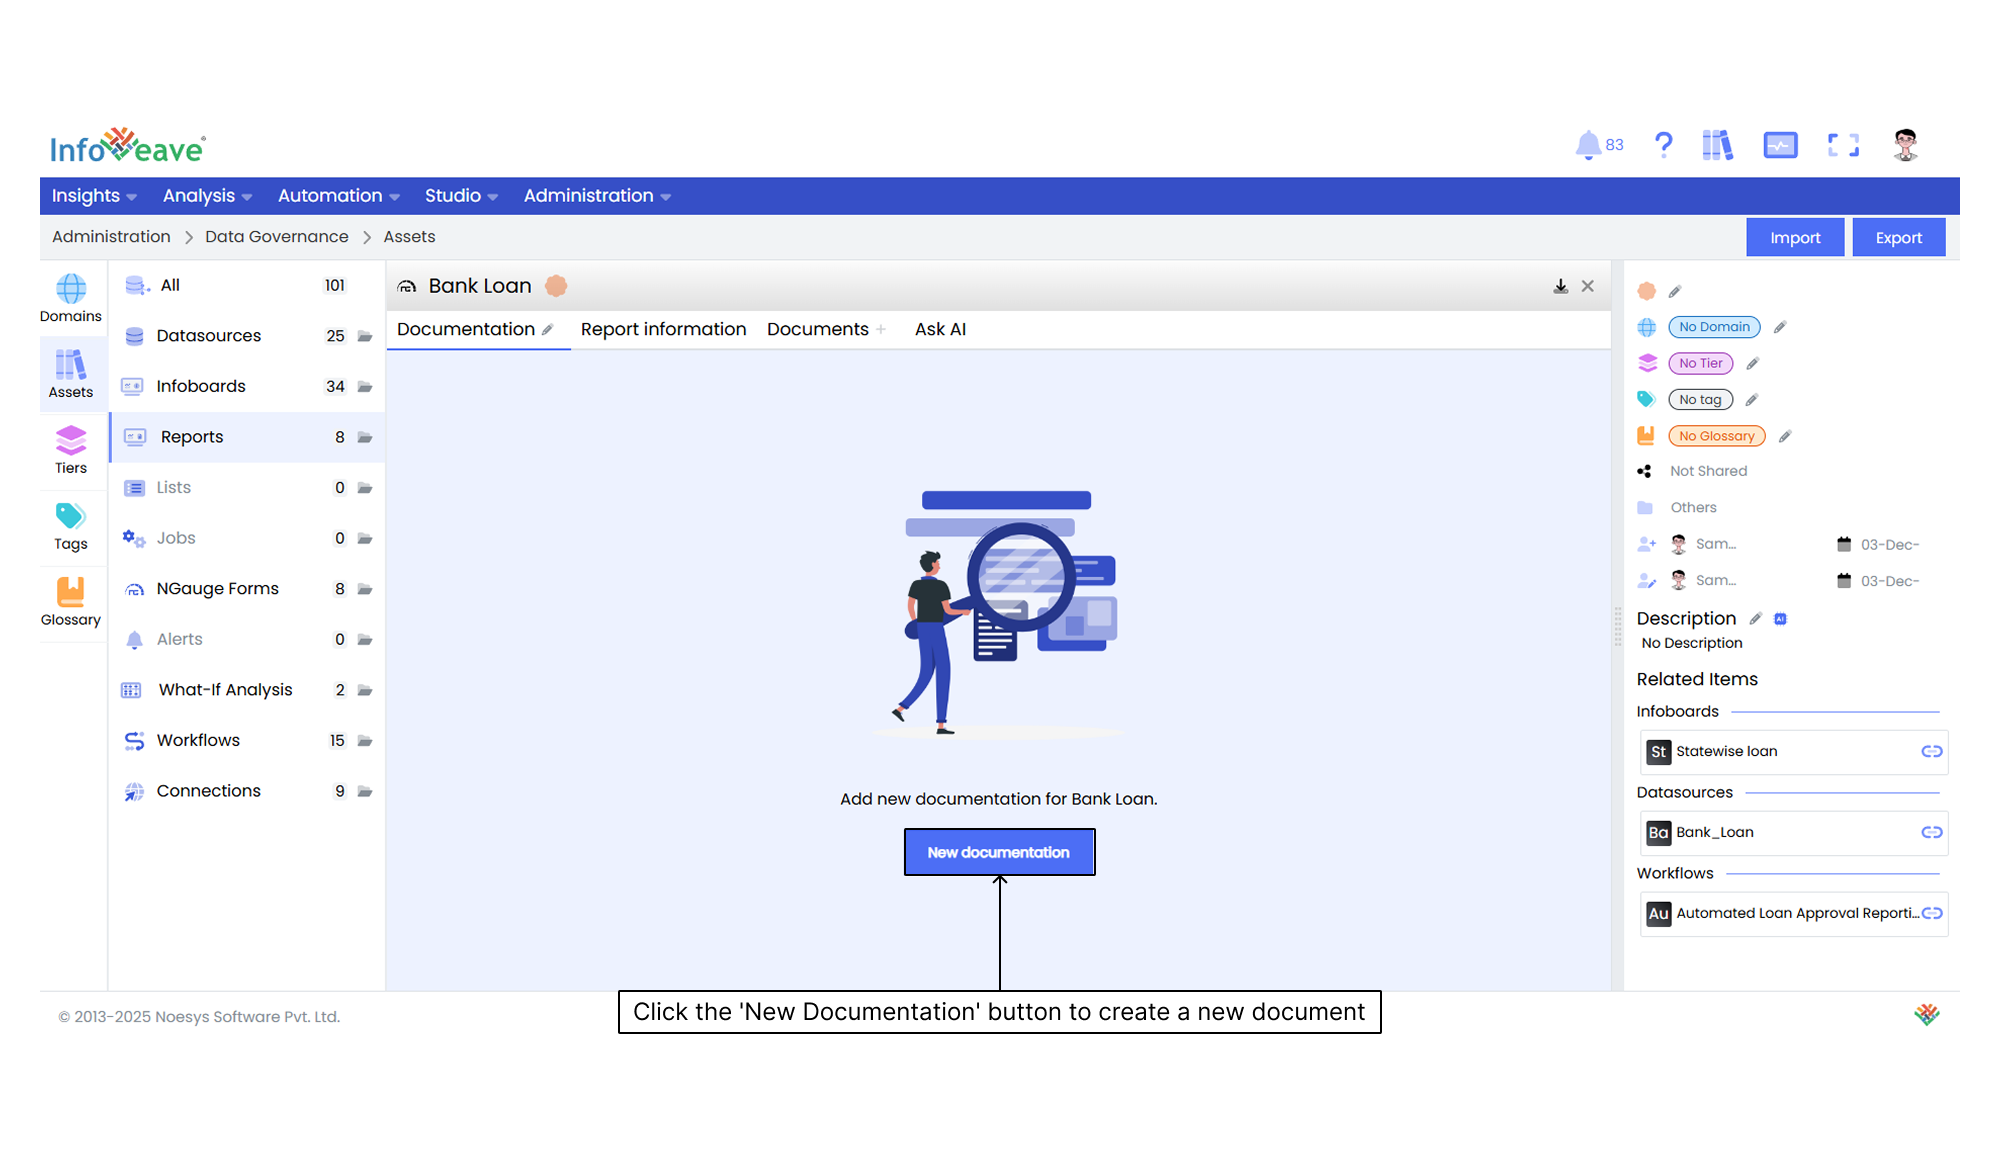
Documentation provides comprehensive information about an asset. It helps you understand its purpose, structure, and functionality. It serves as a reference to ensure clarity and effective utilization of the asset.
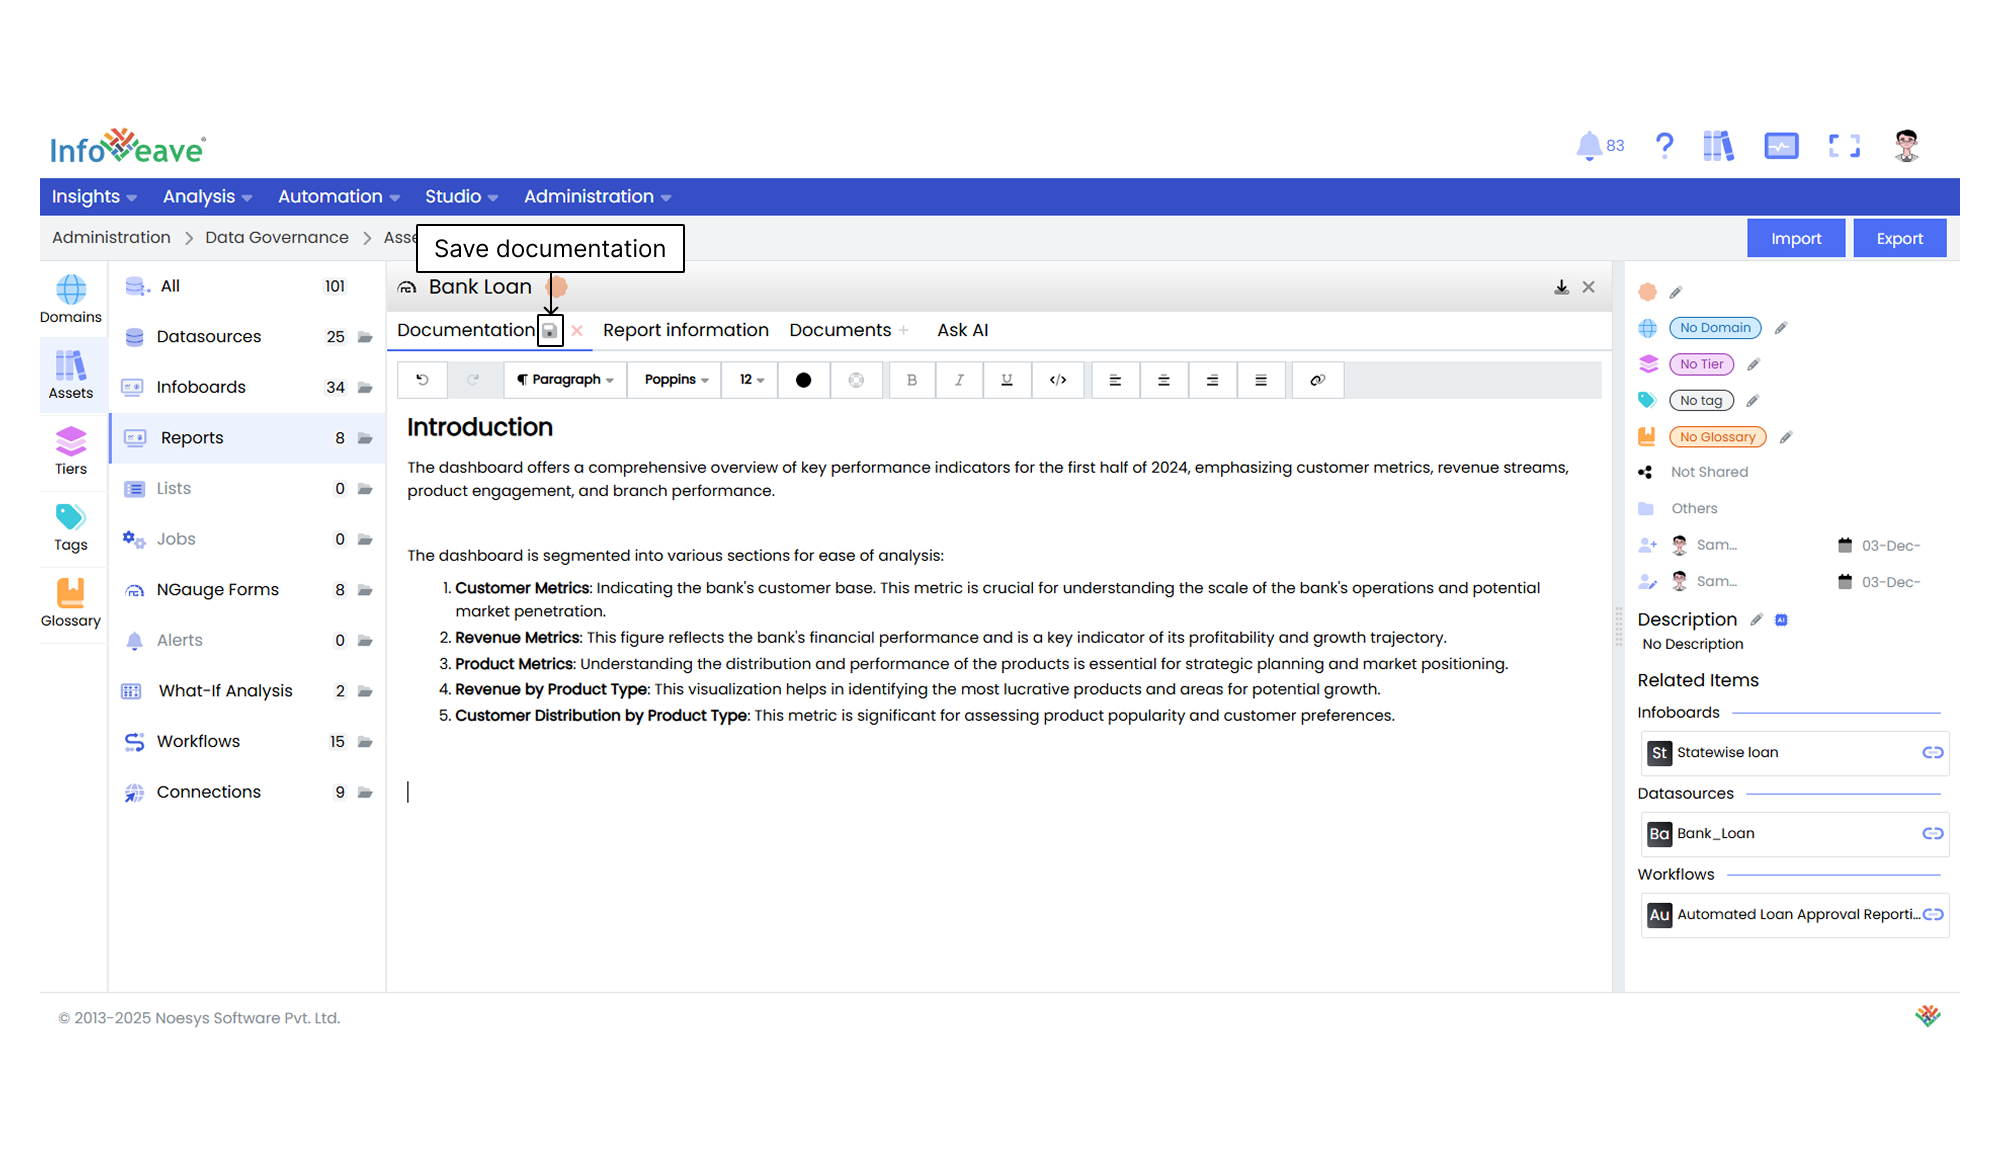
After you click the **New documentation** button, you can compose your documentation in the provided editor. Once you finish writing, click the **Save** icon to store the documentation.
## Report Information
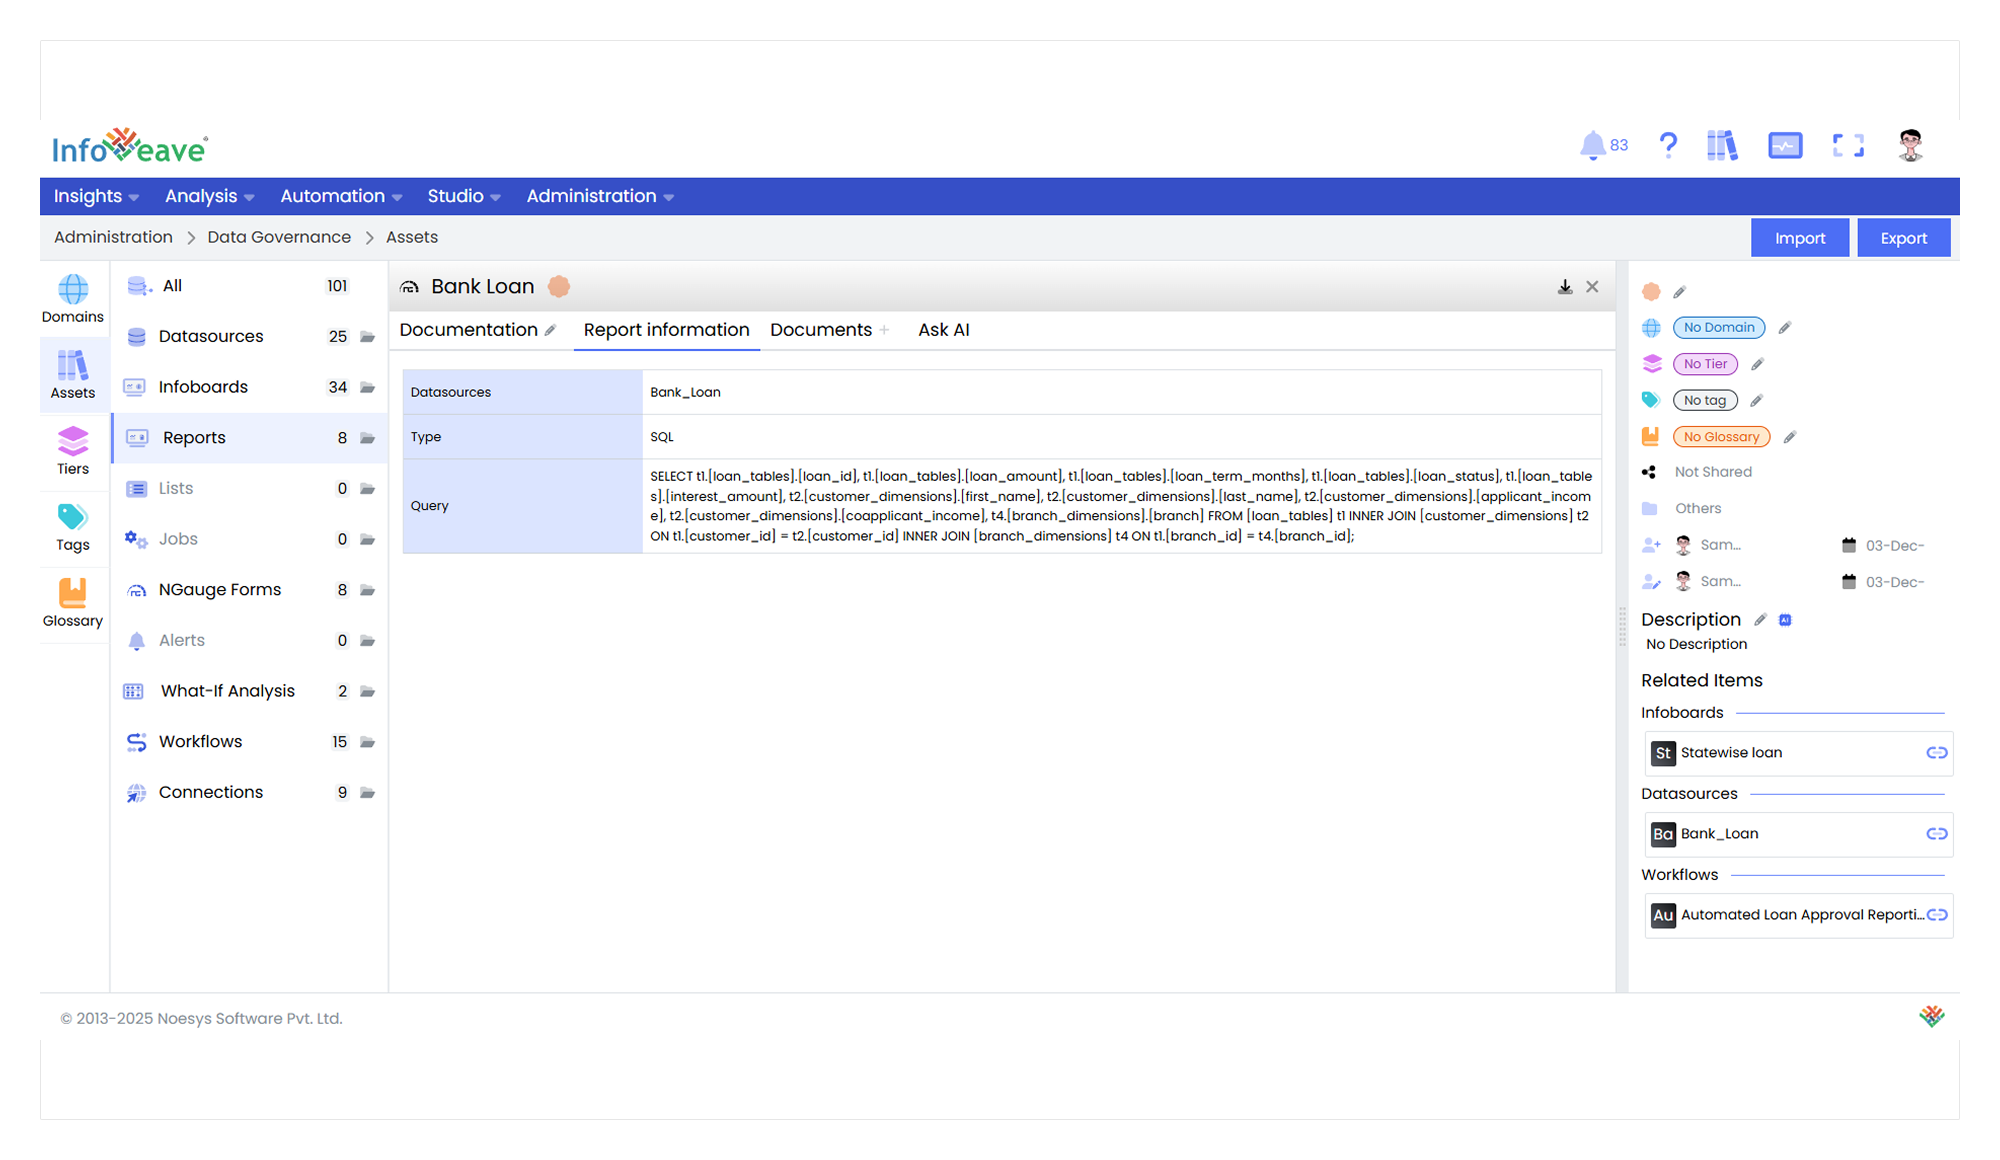
The **Report Information** section gives you a detailed overview of the reports associated with the asset. This section includes the following key details.
**Datasources** Lists the Datasources that have been used to generate the specific report.
**Type** Specifies the file format of the report, such as **xlsx** (Excel). This allows you to understand the type of document and how you can access or use it.
## Documents
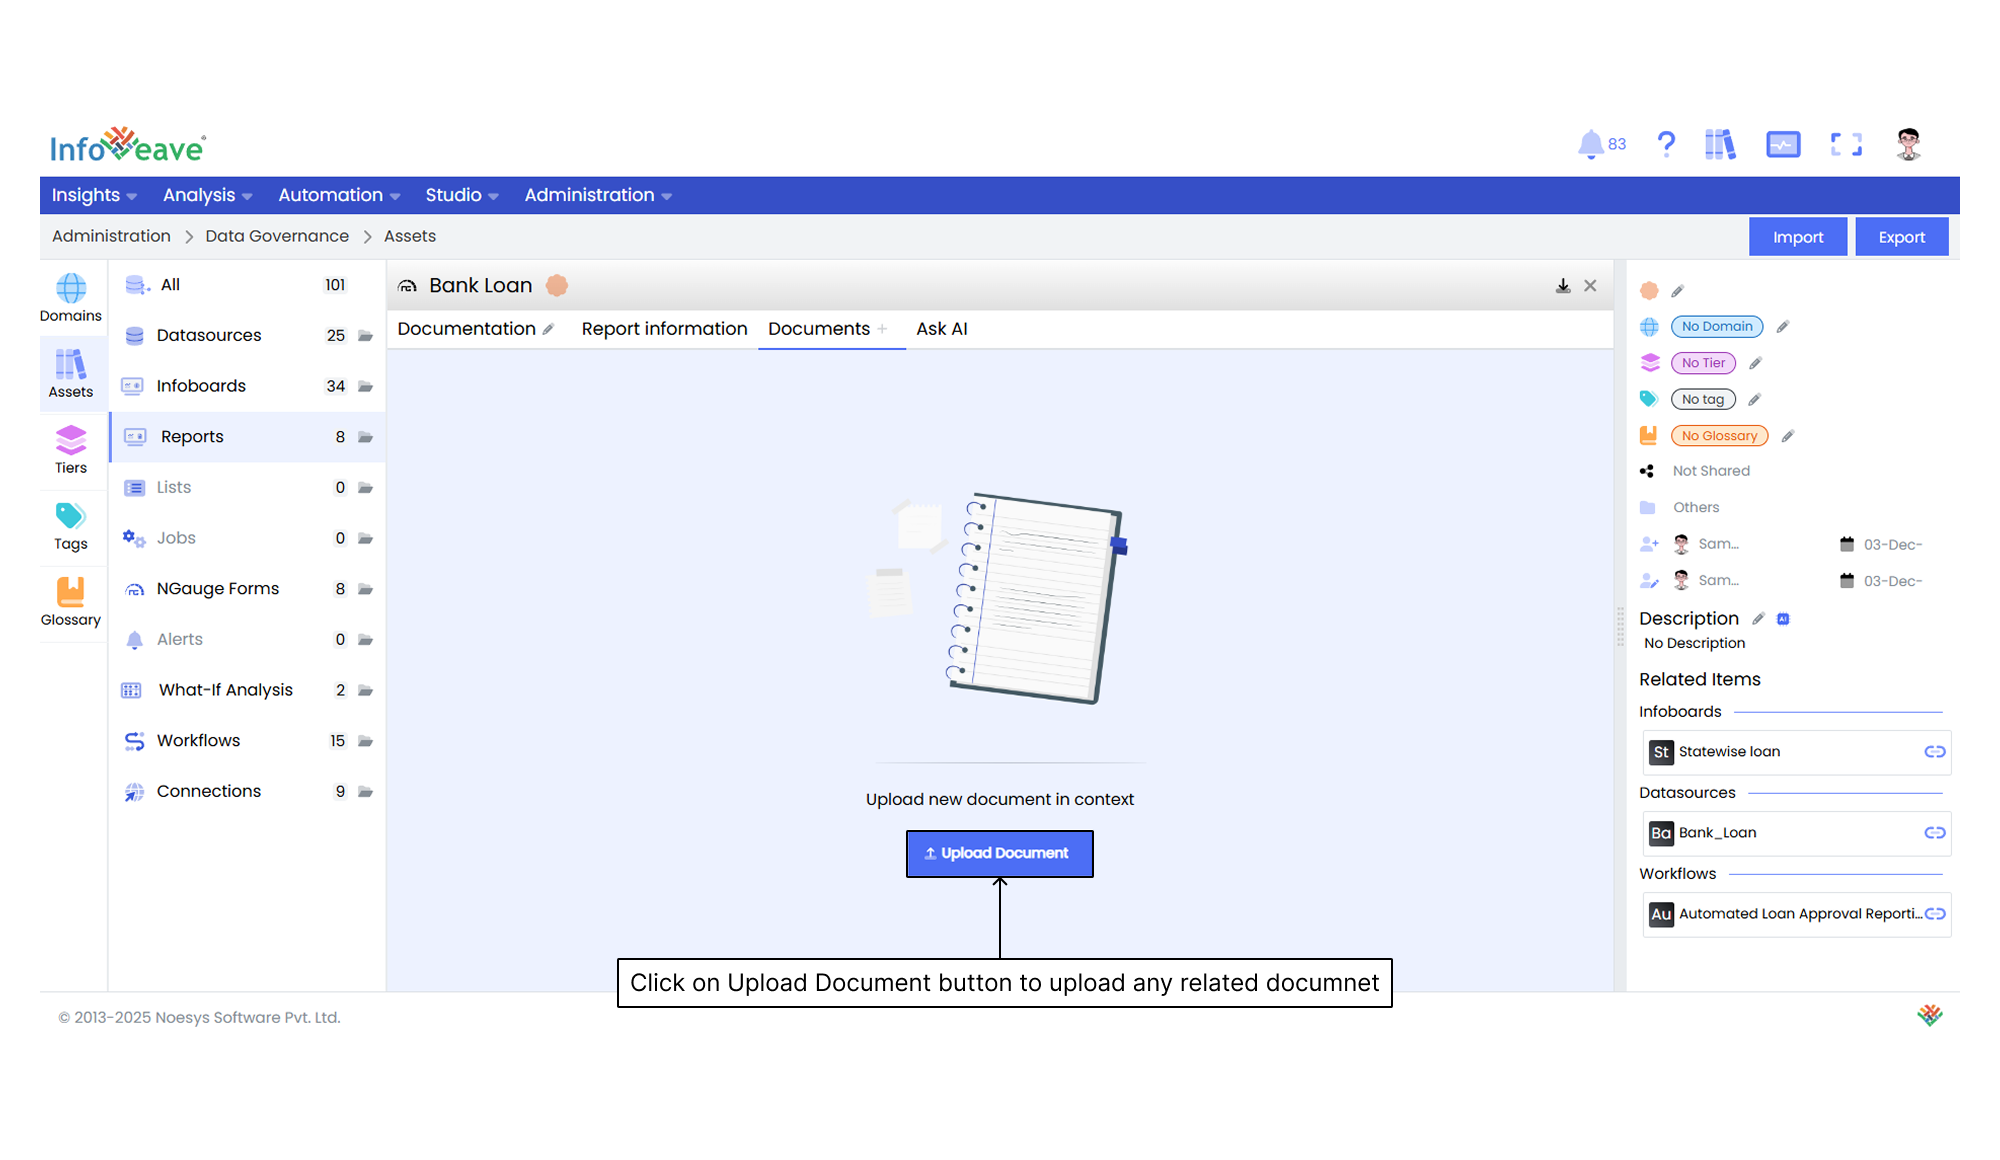
In the **Documents** section, you can upload relevant files that help create a more accurate description of the reports using AI. These documents provide context and improve the AI’s understanding. This helps it generate better descriptions, especially for data that requires detailed and nuanced explanations.
## Using Ask AI
Ask AI enables you to get instant answers to any questions related to a specific asset. It provides quick and context-aware insights to help you enhance understanding and make informed decisions. It uses the available documentation to respond to your queries. If you upload a document in the **Documents** section, it is automatically made available in the Ask AI chat. This allows the assistant to reference it while generating responses.