---
title: Introducing What-If Analysis
description: Perform dynamic What-If Analysis to explore scenarios, manage parameters, set alerts, and export insights.
---
import { Aside , Steps} from '@astrojs/starlight/components';
import { MediaPlayerComponent } from "../../../../components/video-player";
import RunScript from "../../../../components/RunScript.astro";
# Introducing What-If Analysis
Analysis of a What-If Formulae with applied filters is known as What-If Analysis. You have the ability to adjust or modify the values of the variables used in the What-If Formulae while performing a What-If Analysis. This also allows you to explore a broader range of scenarios by running various analysis conditions. What-If Analysis helps you define and manage the parameters for different scenarios and set alerts.
## Creating a What-If Analysis
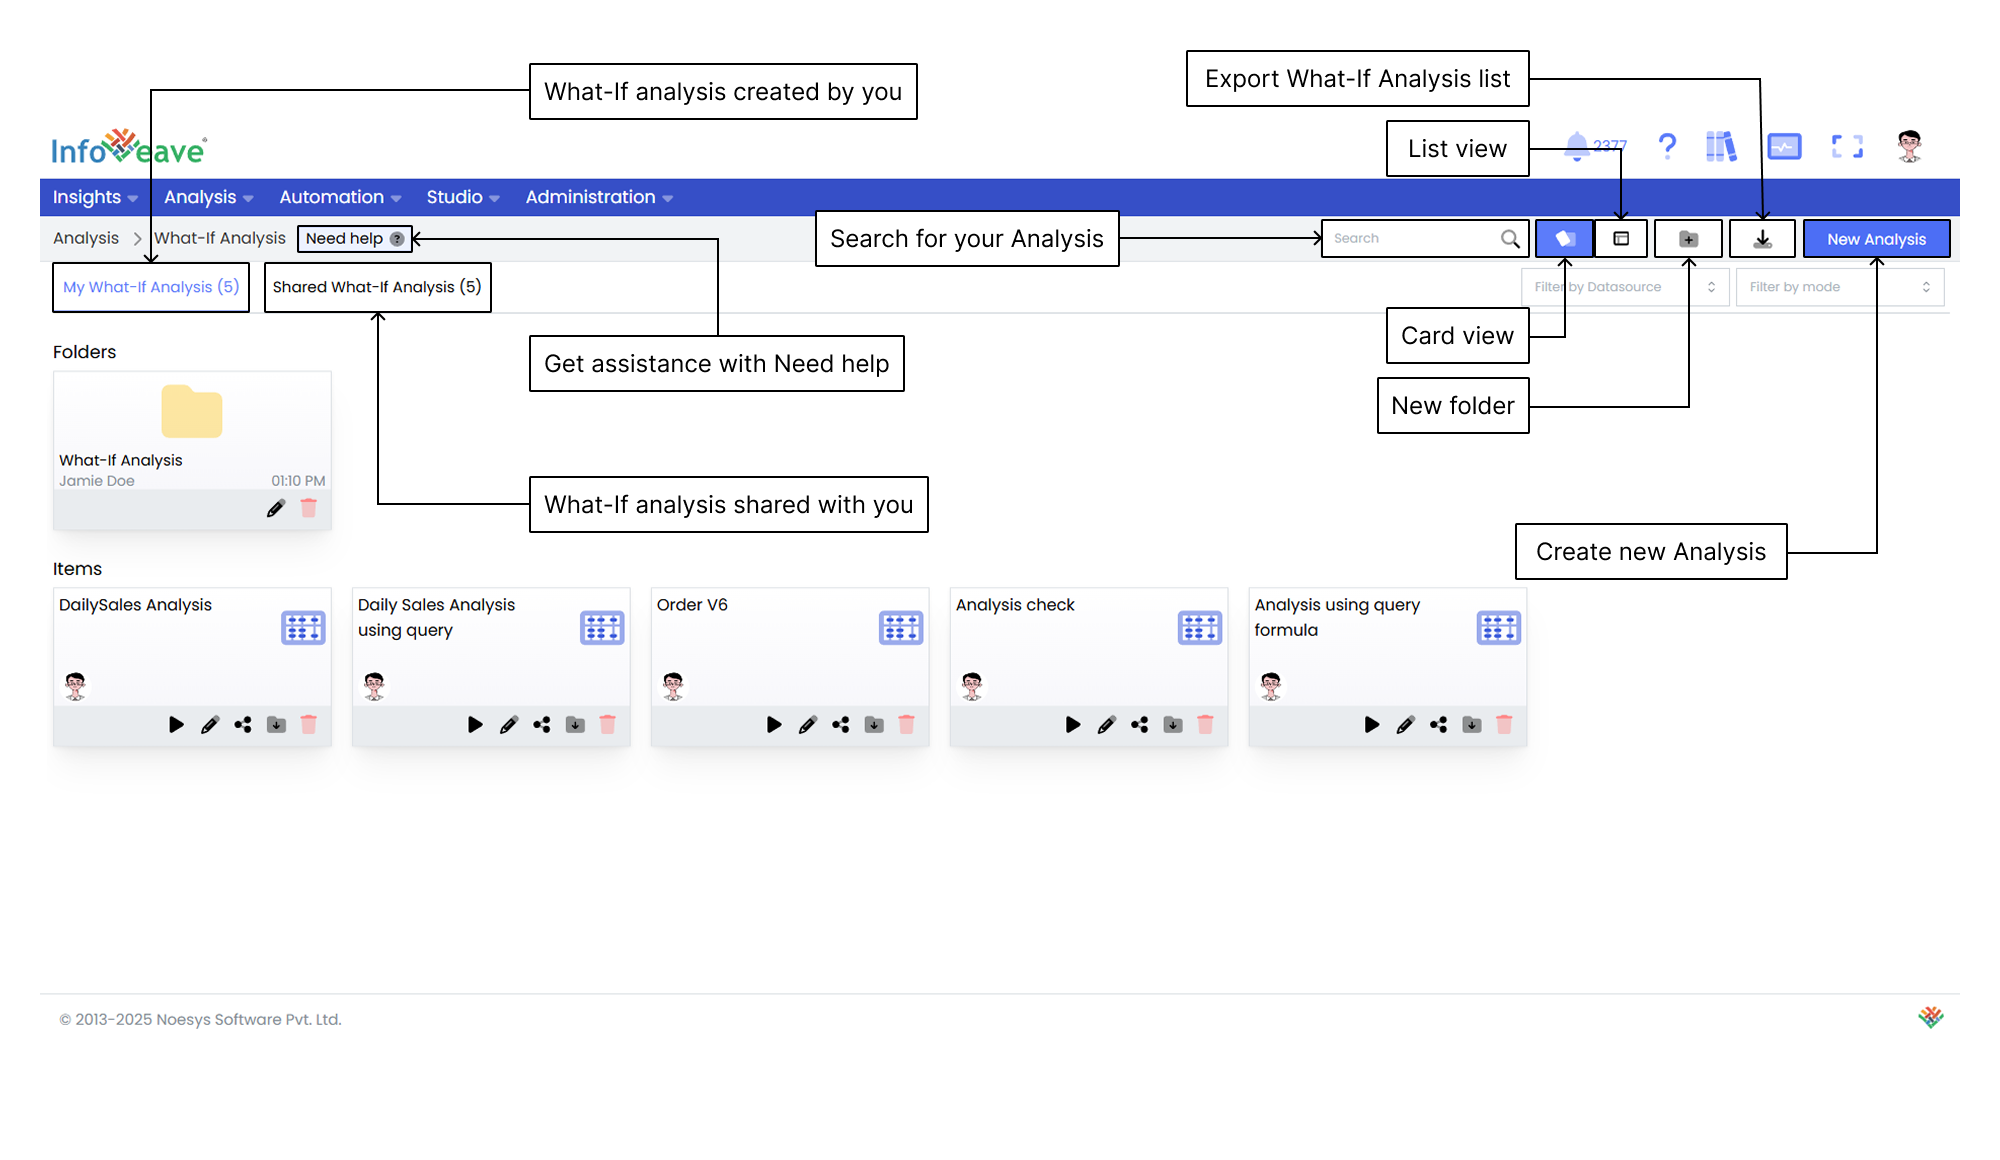
1. To create and execute a What-If Analysis, click on **Analysis** **What-If Analysis** .
2. To start a new analysis, click on **New Analysis**. The What-If dialog box appears.
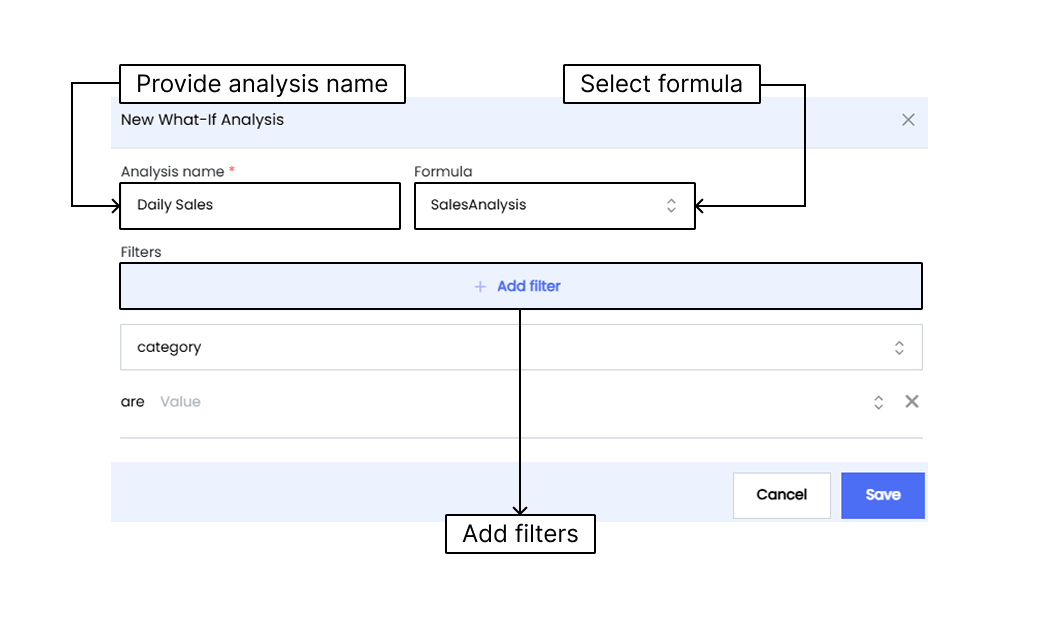
3. Enter the analysis **Name**.
4. Select the formula from the dropdown.
5. To add a dimension filter, click on **Add filter**.
6. Click on **Save** to add the What-If Formulae to Infoveave. You can view the newly created analysis under the **My What-If Analysis** tab.
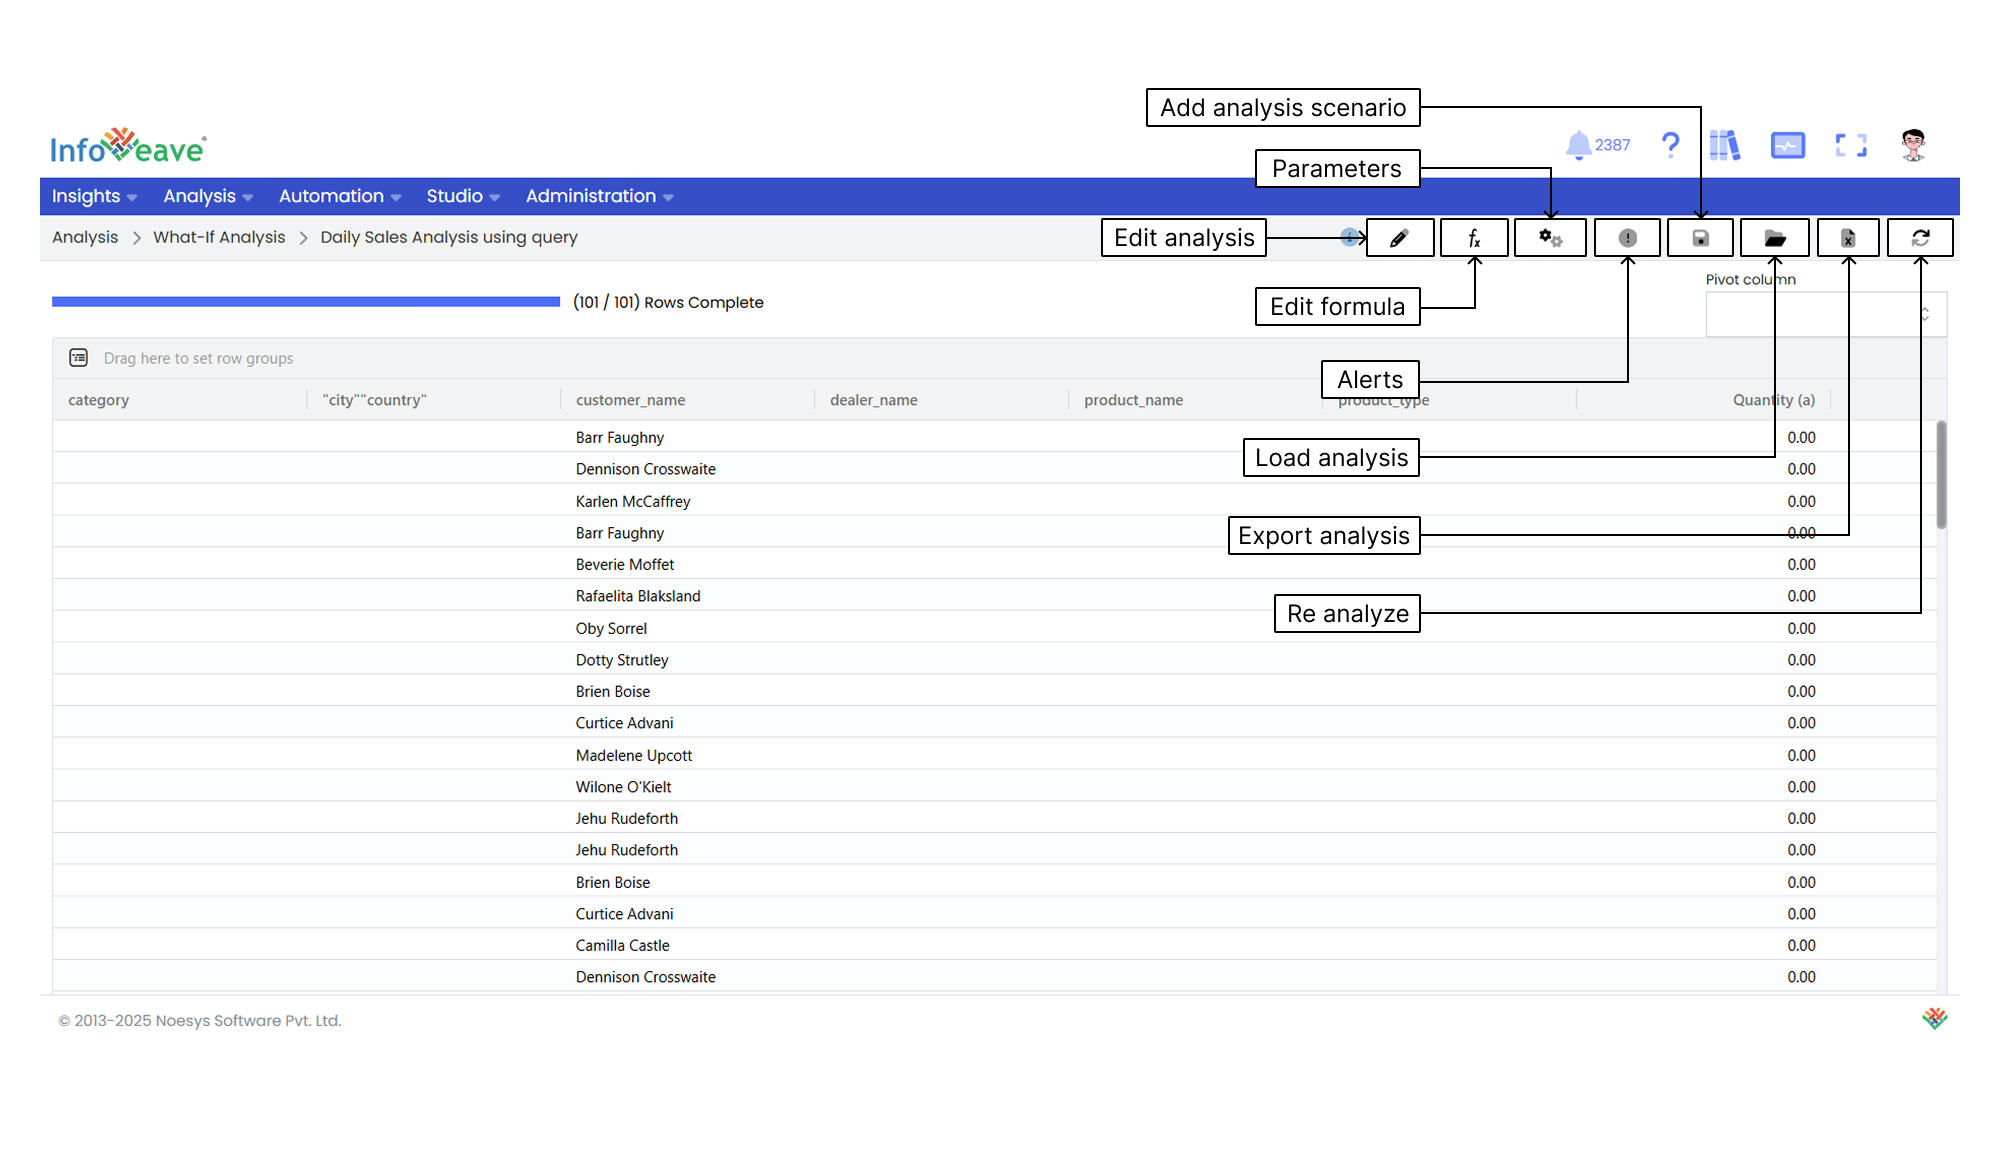
## Executing a What-If Analysis

When you start the execution process, you can run the What-If Analysis with your selected parameters and see the results in a table format.
1. To execute, click on the **Execute** icon on the newly created Formulae.
2. When you click on **Execute**, you must choose whether to have pagination or continue without it.
3. A dialog opens with options such as **Edit analysis**, **Edit formula**, **Parameters**, **Alerts**, **Add analysis scenario**, **Load and Export Analysis**, or **Reanalyze** when needed.
## Grouping Data
The drag-and-drop feature allows you to group data easily by arranging column headings in the group section to create your desired grouping structure.
To group data, follow these steps
1. Find the column headings you want to group.
2. Use drag-and-drop to click and hold a column heading.
3. Drag the column heading into the group section.
4. Place the heading in the desired spot within the group section.
5. Repeat for any additional headings you want to group.
## Editing an Analysis
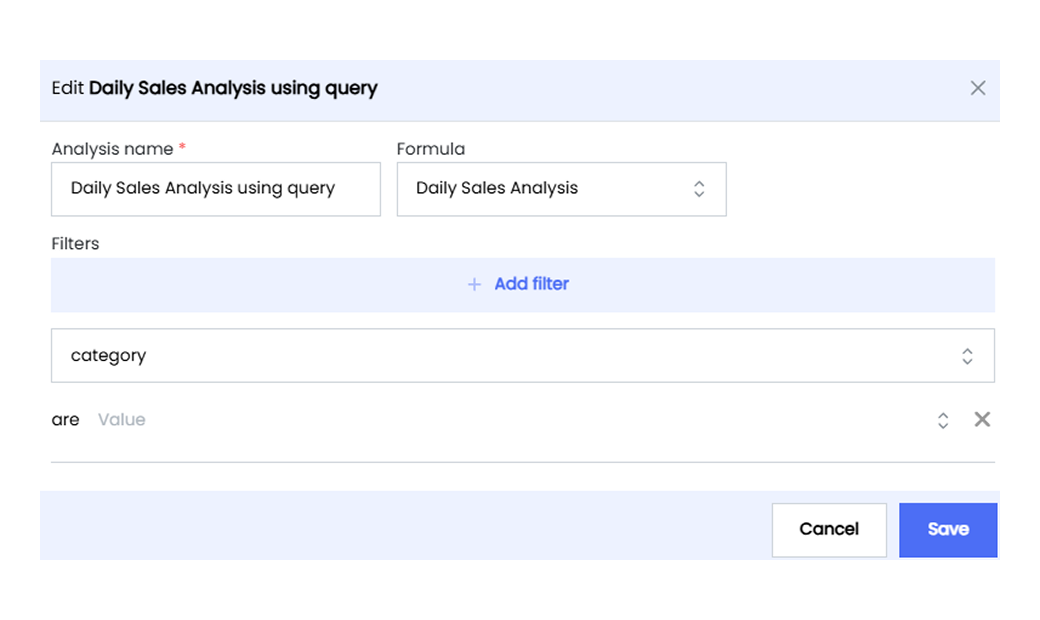
Edit Analysis lets you modify your What-If Analysis to include all required changes and reanalyze the formula.
1. Click the **Edit** icon for the analysis.
2. Make the needed changes to the analysis components:
- **Edit name** Enter a name that reflects the purpose or updates of the analysis.
- **Change formula** Choose a new formula from your previously created ones.
- **Edit/Change filters** Update the filters to focus on specific data subsets.
3. Click **Save** to apply your changes.
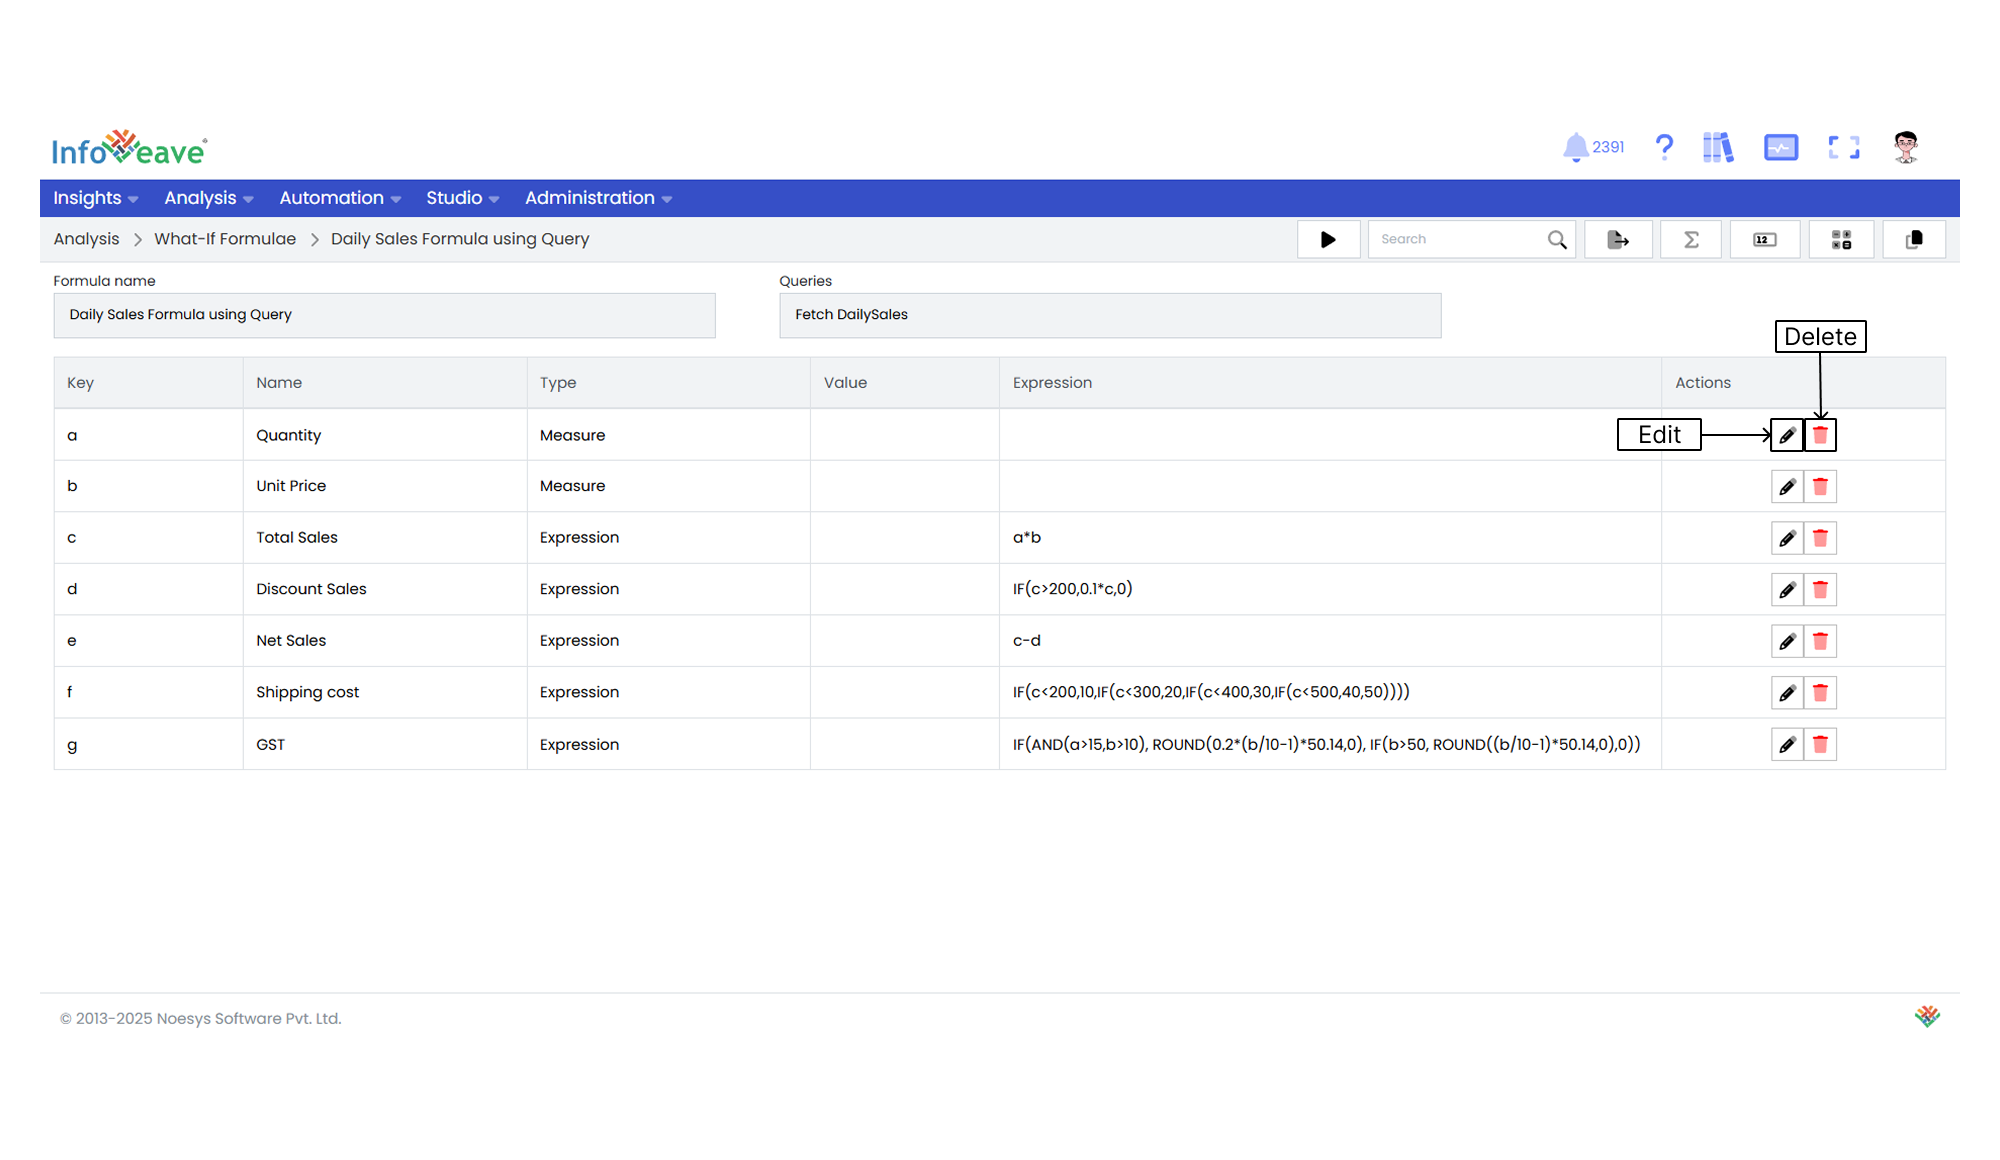
## Editing a Formula
Editing the What-If Formulae in Infoveave allows you to refine the logic, expressions, or parameters of your formula.
1. Find the specific What-If Formulae you want to edit.
2. Click the **Edit** icon for the formula.
3. After making your changes, click **Save**.
## Managing Parameters
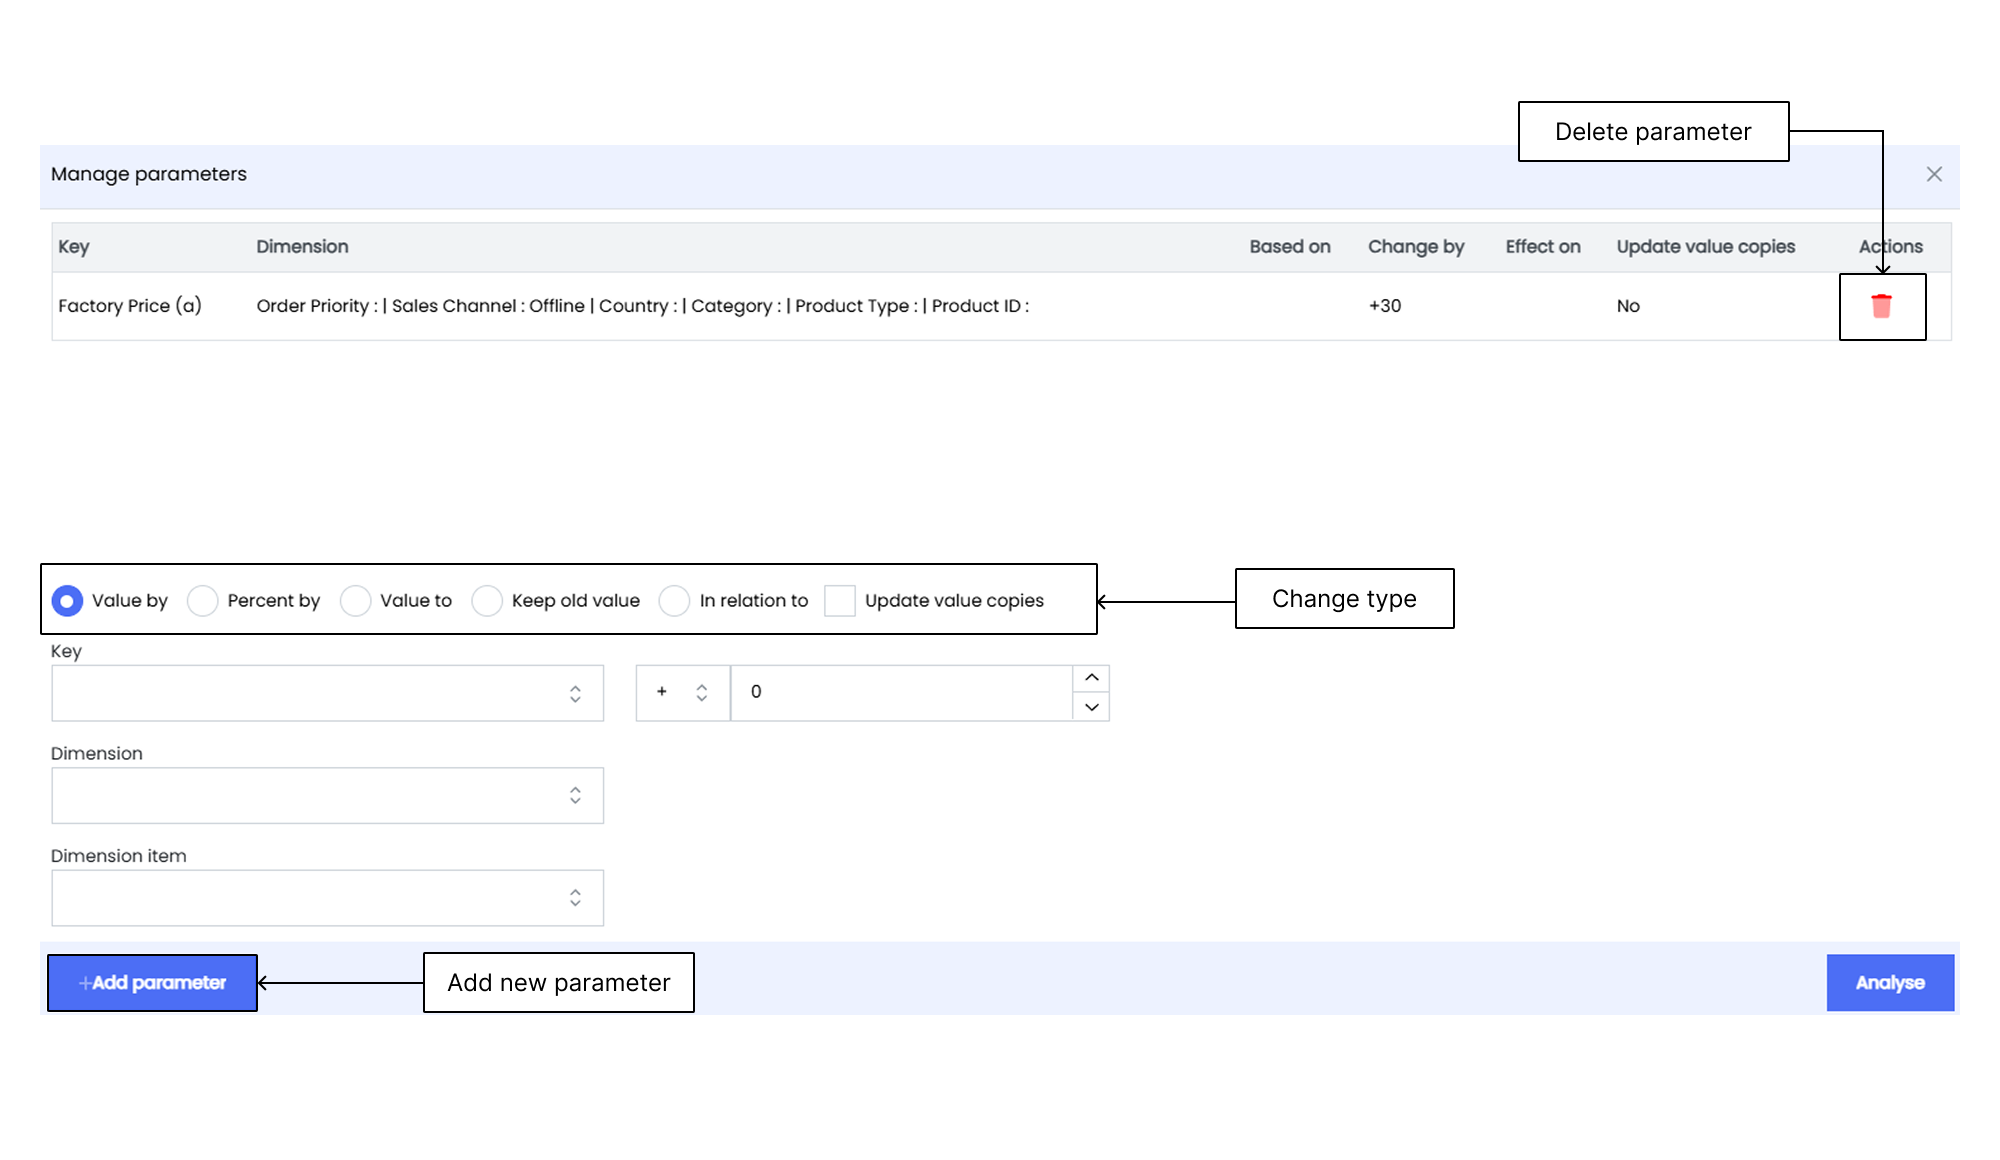
Managing parameters in What-If Analysis helps you explore different scenario outcomes. By defining the key, dimension, and dimension item, you specify the parameters for analysis. The change type options allow you to determine how the values are modified, whether by a specific value, percentage, or based on another parameter.
1. Click the **Parameter** icon .
2. Define Parameters by filling in the following fields
- **Key** Add the key (defined in the What-If Formulae) for the parameter.
- **Dimension** Select the dimension related to the key.
- **Dimension item** Choose the specific item for the selected dimension.
3. Define Change Type by selecting how the values should be modified
- **Value by** Change by a specific number.
- **Percent by** Change by a percentage.
- **Value to** Set a new specific value.
- **Keep old value** Keep the original value.
- **In relation to** Change the value based on another parameter.
#### Value by
- **Key** Enter a unique identifier or key for this parameter. This key helps you distinguish and manage different parameters within your analysis.
- **Dimension** Select the relevant dimension for this parameter. A dimension is an aspect of your data that you want to analyze or modify.
- **Dimension item** Specify the specific item within the selected dimension that you want to focus on. This is the particular element or category you modify.
- **Value** Set the initial value of the parameter. This value represents the starting point for your simulation. You can input a numeric value or use arithmetic operations like addition (+10) to establish the parameter's baseline.
---
#### Percentage by
- **Key** As with the previous parameter, provide a unique identifier or key to differentiate it from others.
- **Dimension** Choose the dimension associated with this parameter. Different dimensions are used to analyze various aspects of your data.
- **Dimension item** Specify the dimension item. This helps you narrow down the specific element within the chosen dimension that you are targeting.
- **Percentage** Define the percentage change for this parameter. It represents the adjustment you want to make, expressed as a percentage. You can input a numeric value (for example, 10) or use arithmetic operations (for example, +10%) to indicate the change.
---
#### Value to
- **Key** Assign a unique identifier to this parameter, just like the others.
- **Dimension** Select the relevant dimension, considering the specific aspect you want to modify.
- **Dimension item** Specify the dimension item to focus on within the chosen dimension.
- **Value** Set the final value for the parameter. This value represents the result you want to achieve after applying changes. You can use numeric values or arithmetic operations (for example, +10) to define the parameter's outcome.
---
#### Keep Old Value
- **Key** Define a unique identifier for this parameter.
- **Dimension** Choose the dimension for this parameter. Dimensions allow you to categorize and organize your data for analysis.
- **Dimension item** Specify the dimension item. This is the data point within the selected dimension that you intend to maintain without changes.
---
#### In Relation to
- **Key** Provide a unique identifier for this parameter.
- **Dimension** Select the dimension associated with this parameter.
- **Dimension item** Specify the specific dimension item.
- **Based on dimension** Choose the base dimension that influences the parameter you are defining.
- **Based on dimension item** Specify the specific item within the base dimension that forms the basis of your parameter.
## Setting Alerts
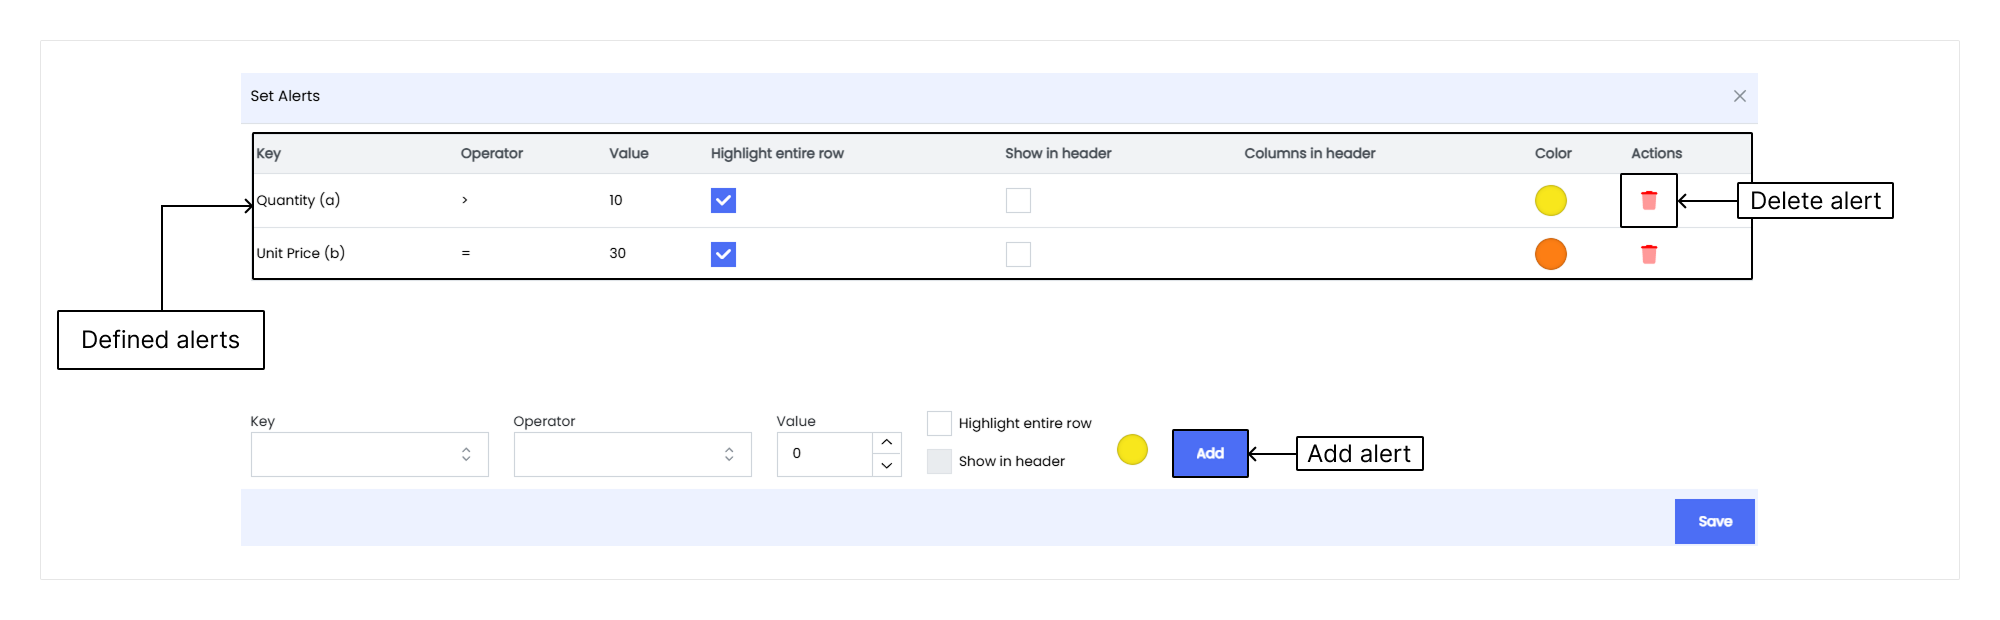
Set alerts in the data table to highlight specific data points.
1. Click the **Alerts** icon .
2. Choose the key parameter for the alert.
3. Select the operator (e.g., greater than, less than, equal to).
4. Enter the value to evaluate.
5. Enable **Highlight Entire Row** to highlight the row.
6. Click **Add** to set the alert.
## Reanalyzing Scenarios
Reanalyzing in Infoveave What-If Analysis lets you rerun the analysis using the original parameters and data.
## Adding an Analysis Scenario

1. **Name** the new analysis.
2. Click **Save** to add the new analysis to Infoveave.
## Loading a Saved Analysis
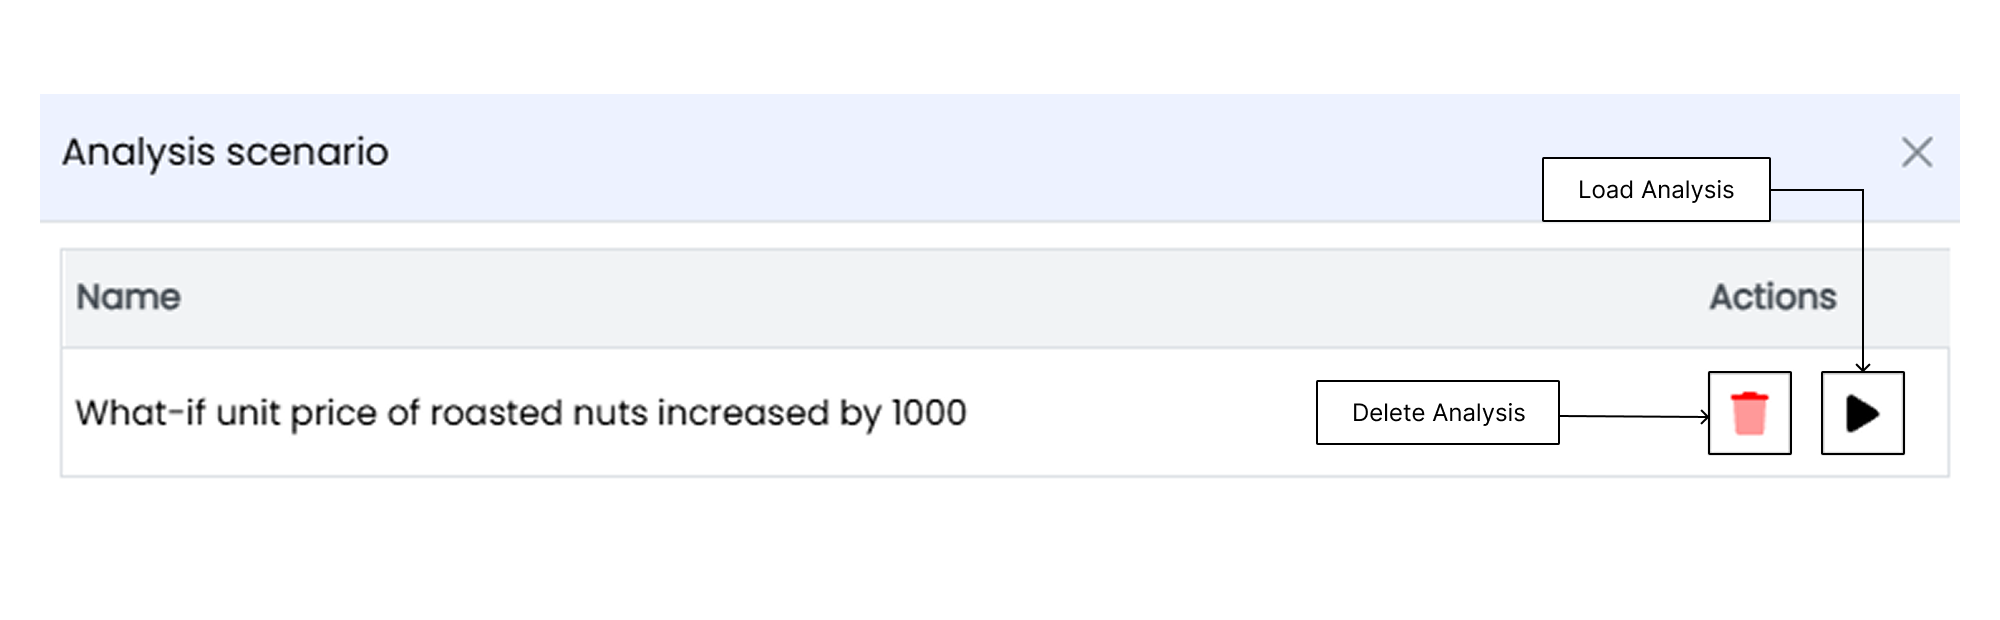
Loading an analysis in Infoveave What-If Analysis enables you to retrieve and review previously saved analysis scenarios. By selecting the desired analysis from your saved list, you quickly access and analyze the parameters, data, and insights generated during the previous analysis session.
To load a saved analysis
1. Click **Load analysis**.
2. Select the analysis and click the **Play** icon.
3. To delete an analysis, click the **Delete** icon.
## Exporting a What-If Analysis
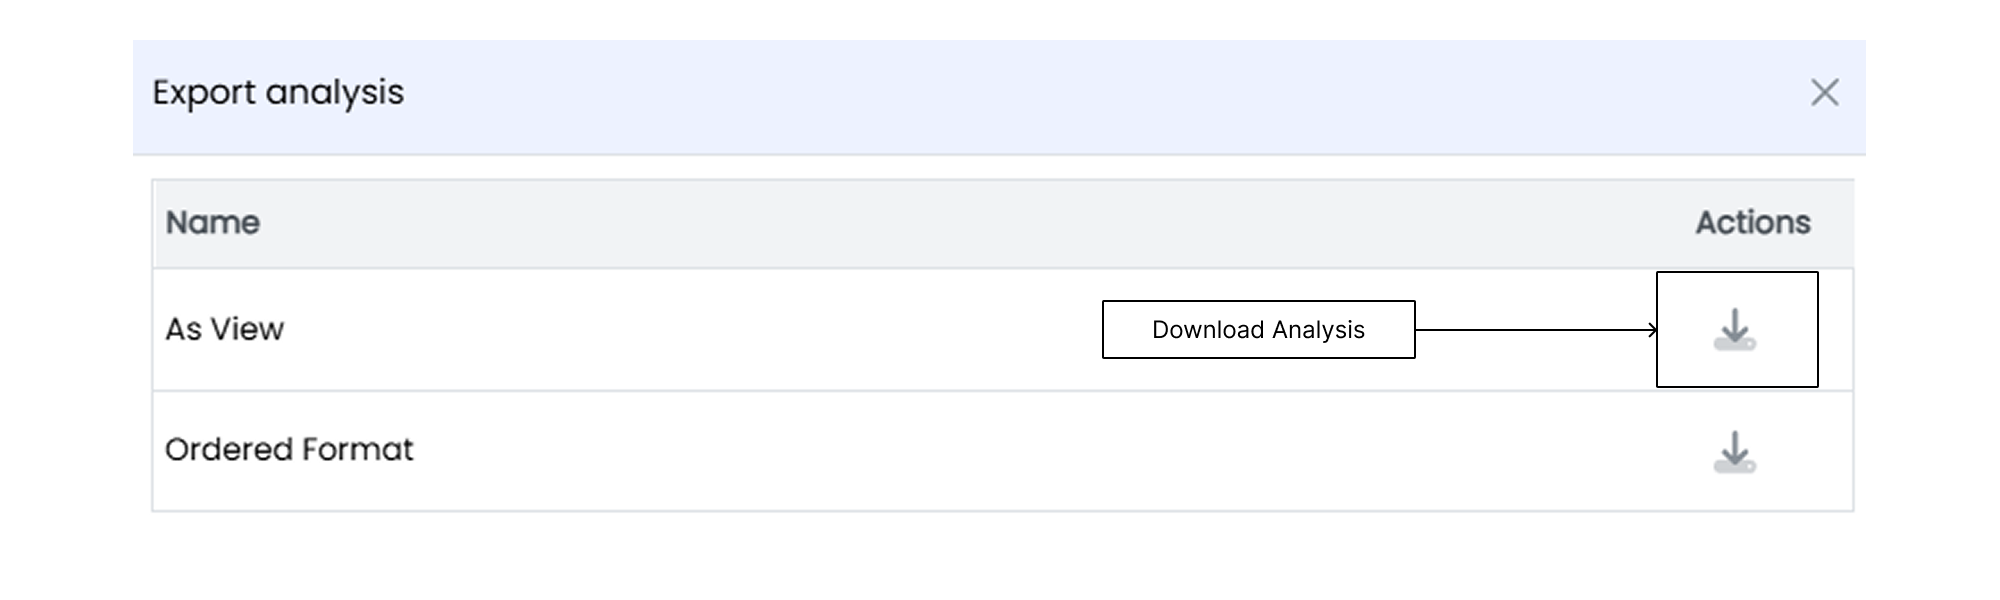
Exporting an analysis in Infoveave What-If Analysis empowers you to save and share your analysis results in different formats. By exporting the analysis, you generate reports, create visualizations, or use the data for further analysis in external tools.
1. Click **Export analysis** to download the file as `.xlsx`.
2. Click the **Download** icon to get the file.