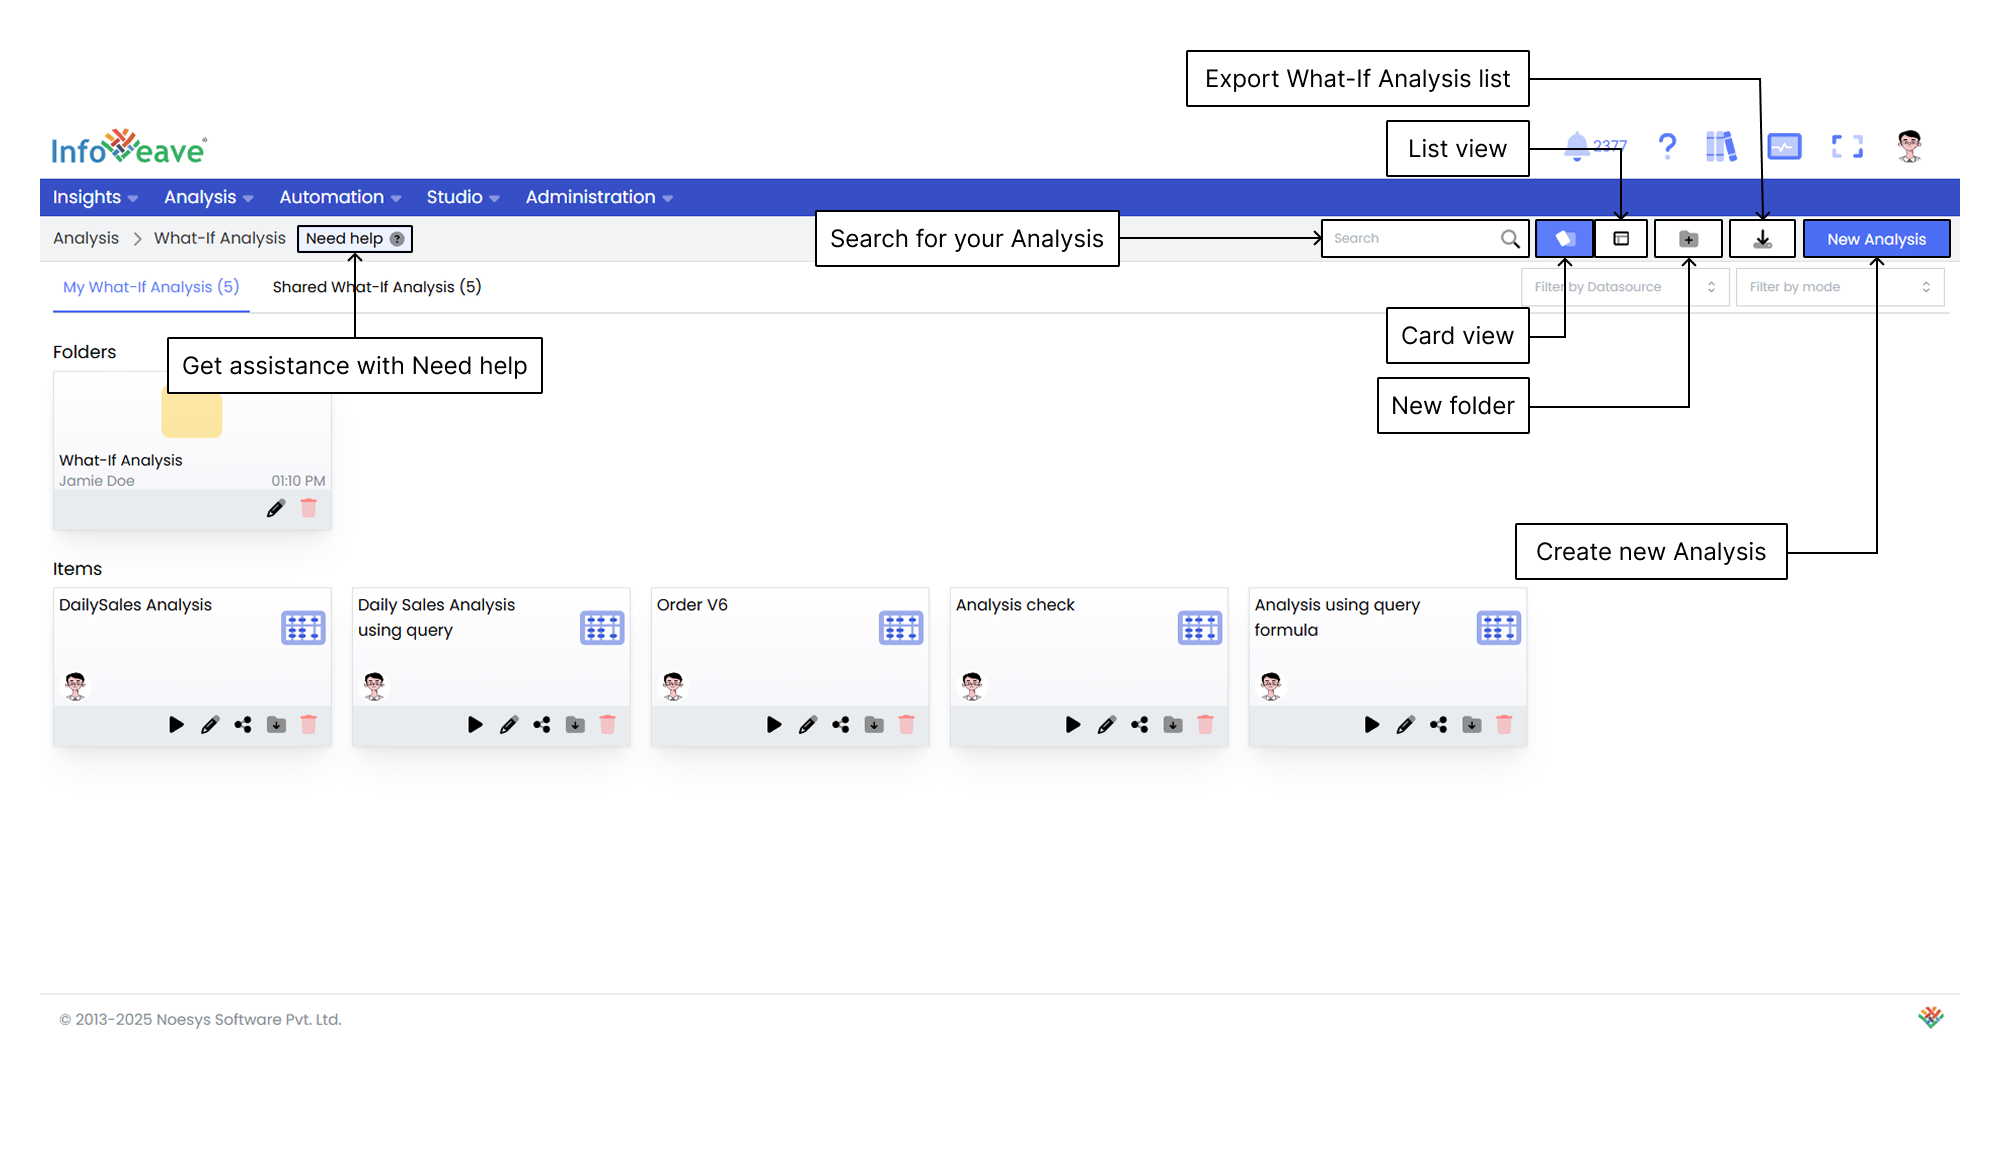
What-If Analysis Toolbar

Getting help
If you are unsure about how to create a What-If Analysis in Infoveave, you can always get assistance by clicking the Need help button. When you click the button, you are directed to a visual walkthrough that shows you how to create a Datasource.

- Select What-If Formula Choose the specific What-If Formula from the available options. This sets the foundation for analyzing various scenarios based on the selected formula.
- Execute Analysis Start the execution process to perform the What-If Analysis using your selected parameters. This step displays the outcome in a table format, showing the calculated data based on the What-If formulas you have created.
- Perform Goal-Seeking Using Parameters Manage parameters to explore different scenarios and analyze the outcomes. Define key, dimension, and dimension item parameters. Specify how values will be modified, whether by a specific value, a percentage, or based on another parameter.
- Reanalyze Scenario Based on Outcomes Reanalyze scenarios to update the results of the analysis based on any changes made to the parameters. This step helps you refine your analysis iteratively by incorporating new parameter adjustments.
- Save and Export Analysis Save and export the analysis to preserve and store the analyzed parameters and processed data. By naming and adding the analysis to Infoveave, you can access and manage multiple analysis scenarios. This enables you to generate reports, create visualizations, or use the data for further analysis.
Using the Search Bar
The Search Bar at the top right of the screen allows you to quickly find any analysis within the platform. Enter keywords related to the name of the analysis or any part of the content you are searching for.
Viewing Items in Card Layout
When you click the Card option in the layout filter, the items are shown in a card-based view. This is the default layout for organizing What-If Analysis. This layout provides a more visual representation of the What-If Analysis and folders, making it easier for you to identify and organize items.
Viewing Items in List Layout
When you click the List option, the layout changes to a table view. This displays the items and folders in a detailed, structured format. This layout is ideal if you prefer seeing data in rows and columns, giving you quick access to information such as the item name, type, creation date, last update date, and more.
Creating a New Folder
To organize your What-If Analysis more efficiently, you can create a new folder.
- Click the New Folder button. This opens a popup where you can configure your new folder.
- In the popup that appears, enter a name for your new folder. Choose a name that helps you identify the folder’s purpose.
- After entering the folder name, click the Save button to create the folder. The new folder appears under the Folders section.
Exporting the What-If Analysis list
The Export What-If Analysis List feature allows you to download a structured file that contains all available What-If Analysis in the system. This feature streamlines data management by giving you a complete overview for analysis, reporting, and sharing.
Creating a New Analysis
To learn about creating a new analysis, visit Creating a What-If Analysis
Filtering by Mode
The Filter by mode option lets you filter your analysis based on the mode of the data.