
Infoboard Setup
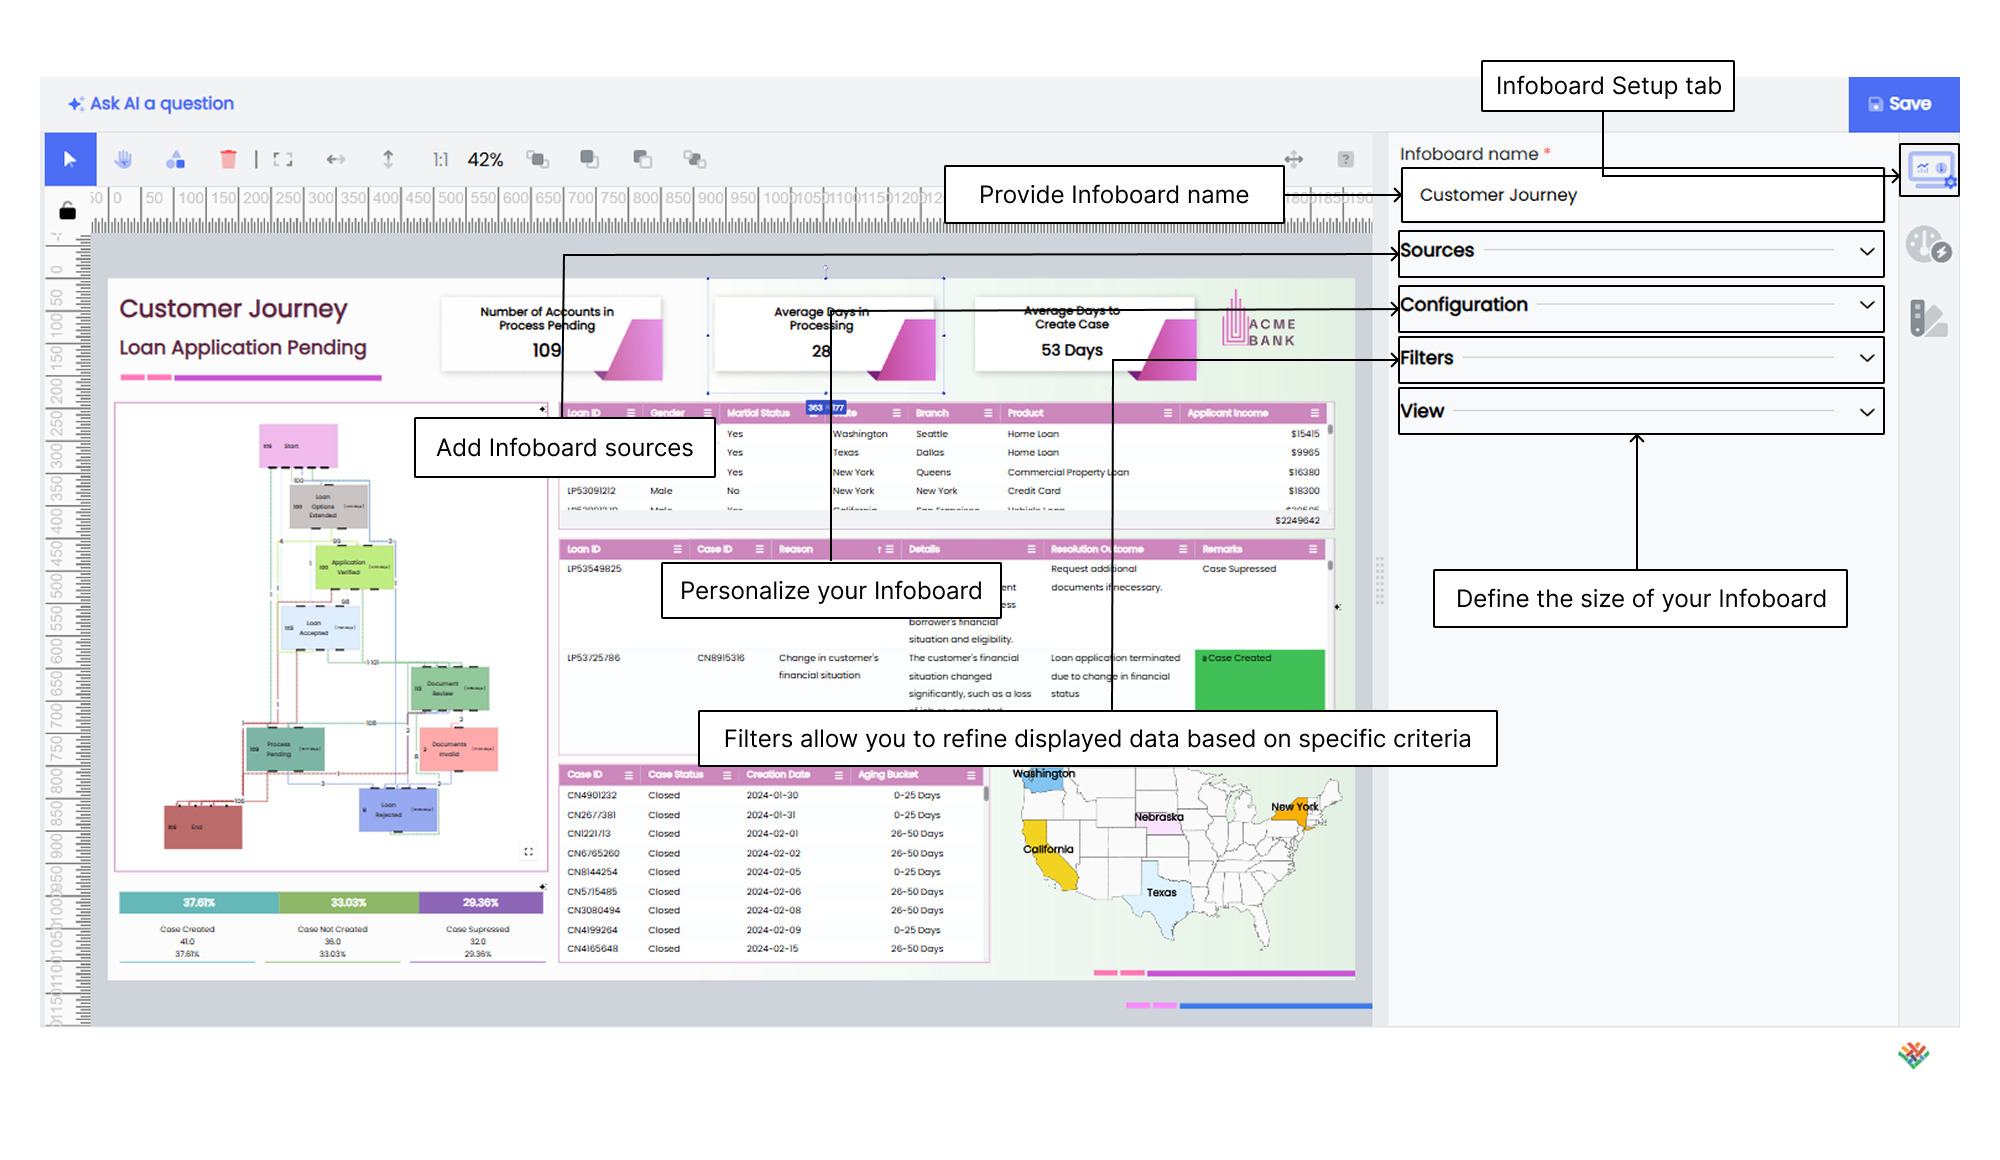
The Infoboard Setup tab provides key options for configuring your Infoboard. You can name your Infoboard, connect it to data sources, apply filters, manage color palettes, and configure page settings. Here’s how you can use the Infoboard Setup tab effectively.
Sources
Add Infoboard sources to bring data into your widgets. You can use existing Datasources, SQL queries, or raw data.
Define Infoboards
Customize your Infoboard by naming it, setting a date range, and selecting relevant workflows to tailor the Infoboard to your needs.
Color palette
Set up colors for dimensions and measures by selecting the relevant Datasource, specifying the type (dimension or measure), and choosing colors.
Filters
Configure filters easily to narrow down the data based on specific criteria.
Adding Infoboard Datasources
This section explains how you link a Datasource to your Infoboard.
Datasource
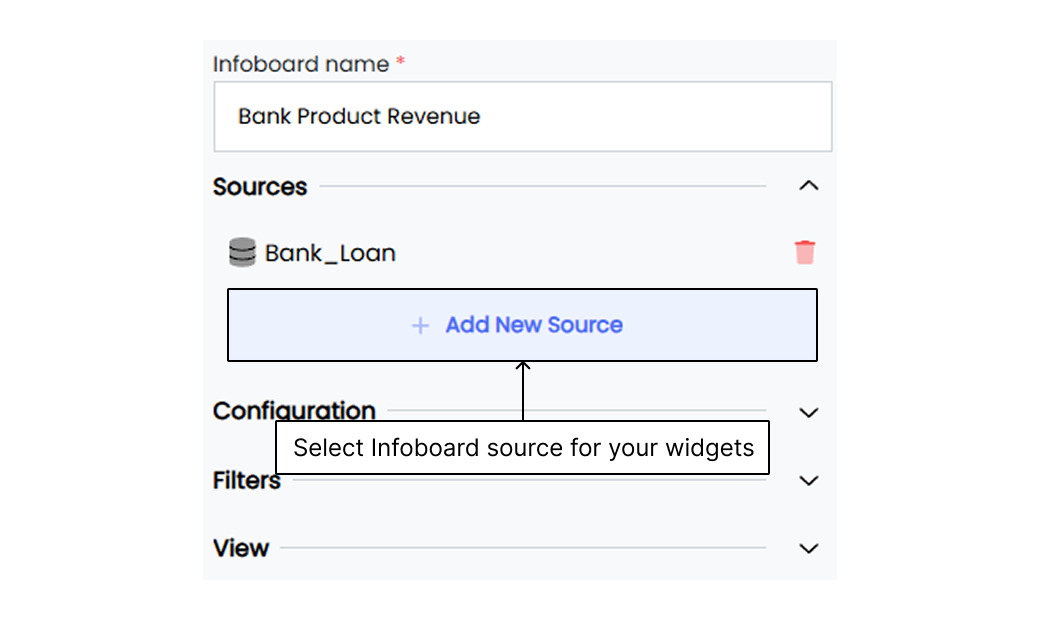
This section guides you through selecting an appropriate existing Datasource for your Infoboard.
- Select Sources and click + Add New Source to choose the Infoboard source for your widgets.
- To use an existing Datasource, click Select datasource.
- Pick the right Datasource from the available list to use in your widgets.
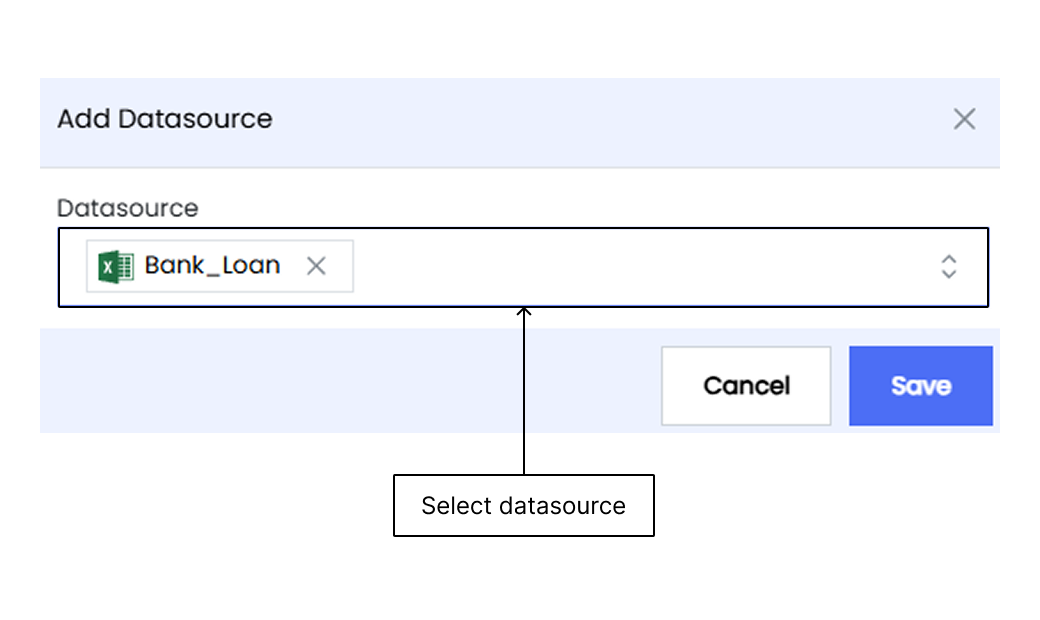
- Click Save to save the selected Datasource.
Query Datasource
This section provides detailed guidance on setting up and using SQL queries as an Infoboard source from an existing Datasource. It explains how to compose, name, run, and save SQL queries. It also includes tips on using query editing options and applying date filters.
Here is a step-by-step guide on how to effectively add a query source for your Infoboard.
- Select Sources and click + Add New Source to choose the query source.
- Click Use query to begin using the query option.
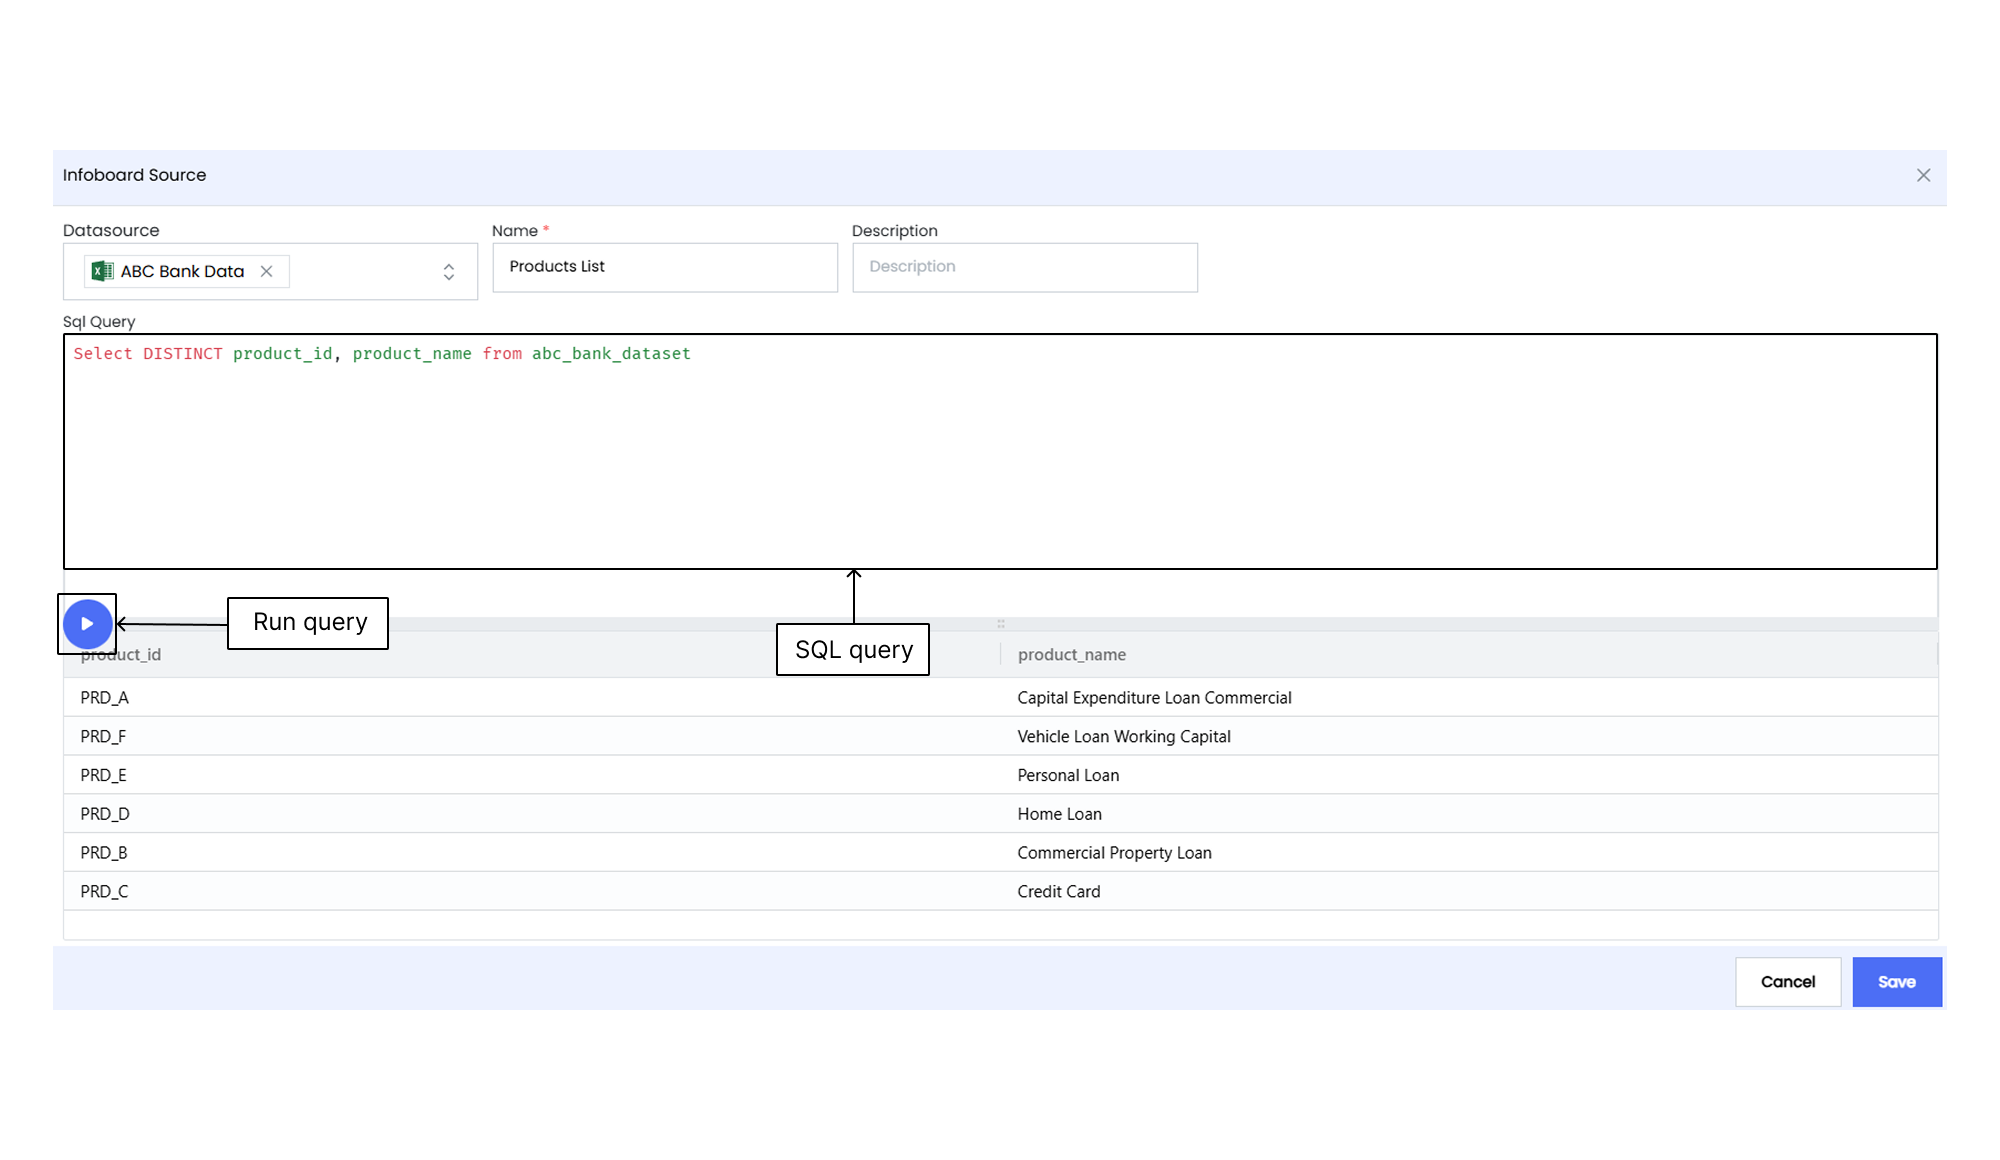
- Give the query a clear name for easy identification.
- Select the Datasource where you want to run your query.
- Write the SQL query including SELECT statements, conditions, joins, and necessary clauses.
- Click the Run icon to execute the query and generate the table.
- Click Save to save your SQL query.
Right-click options in the query editor
Change all occurrences Modify all instances of a specific term or expression within the query.
Cut Remove the selected portion of the query and store it in the clipboard.
Copy Duplicate the selected portion of the query and store it in the clipboard.
Paste Insert the contents from the clipboard into the query.
Command palette Access a range of additional functions and commands related to query editing and management.
Date filter options appear only if your SQL query includes a date filter.
Raw Datasource
This section explains how you use raw Excel data to create an Infoboard Datasource.
- Select Sources and click + Add New Source.
- Click Use raw data.
- Enter a name for the source.
- Copy your raw Excel data.
- Paste the data into the setup area.
- Click the View Table icon to preview the table.
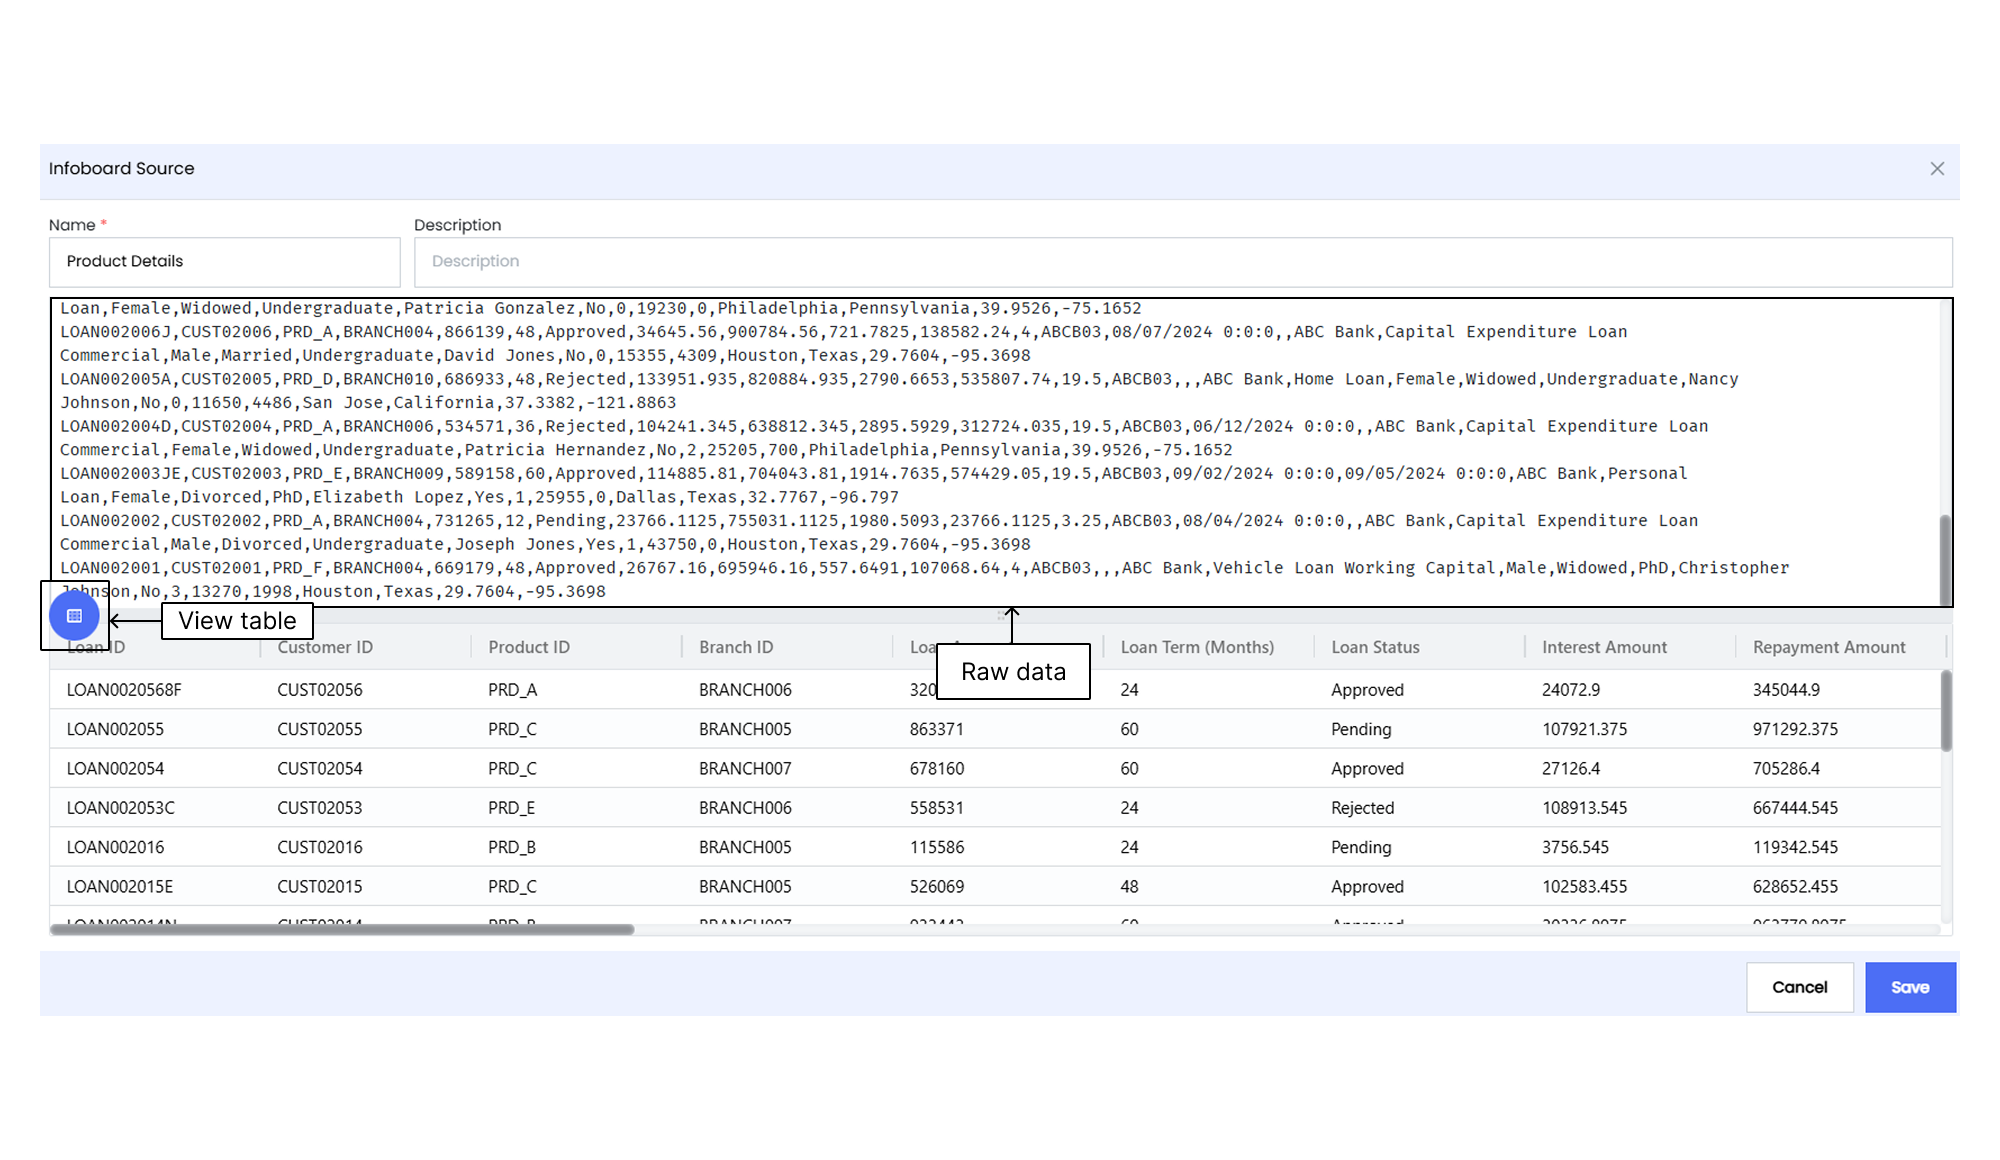
- Click Save.
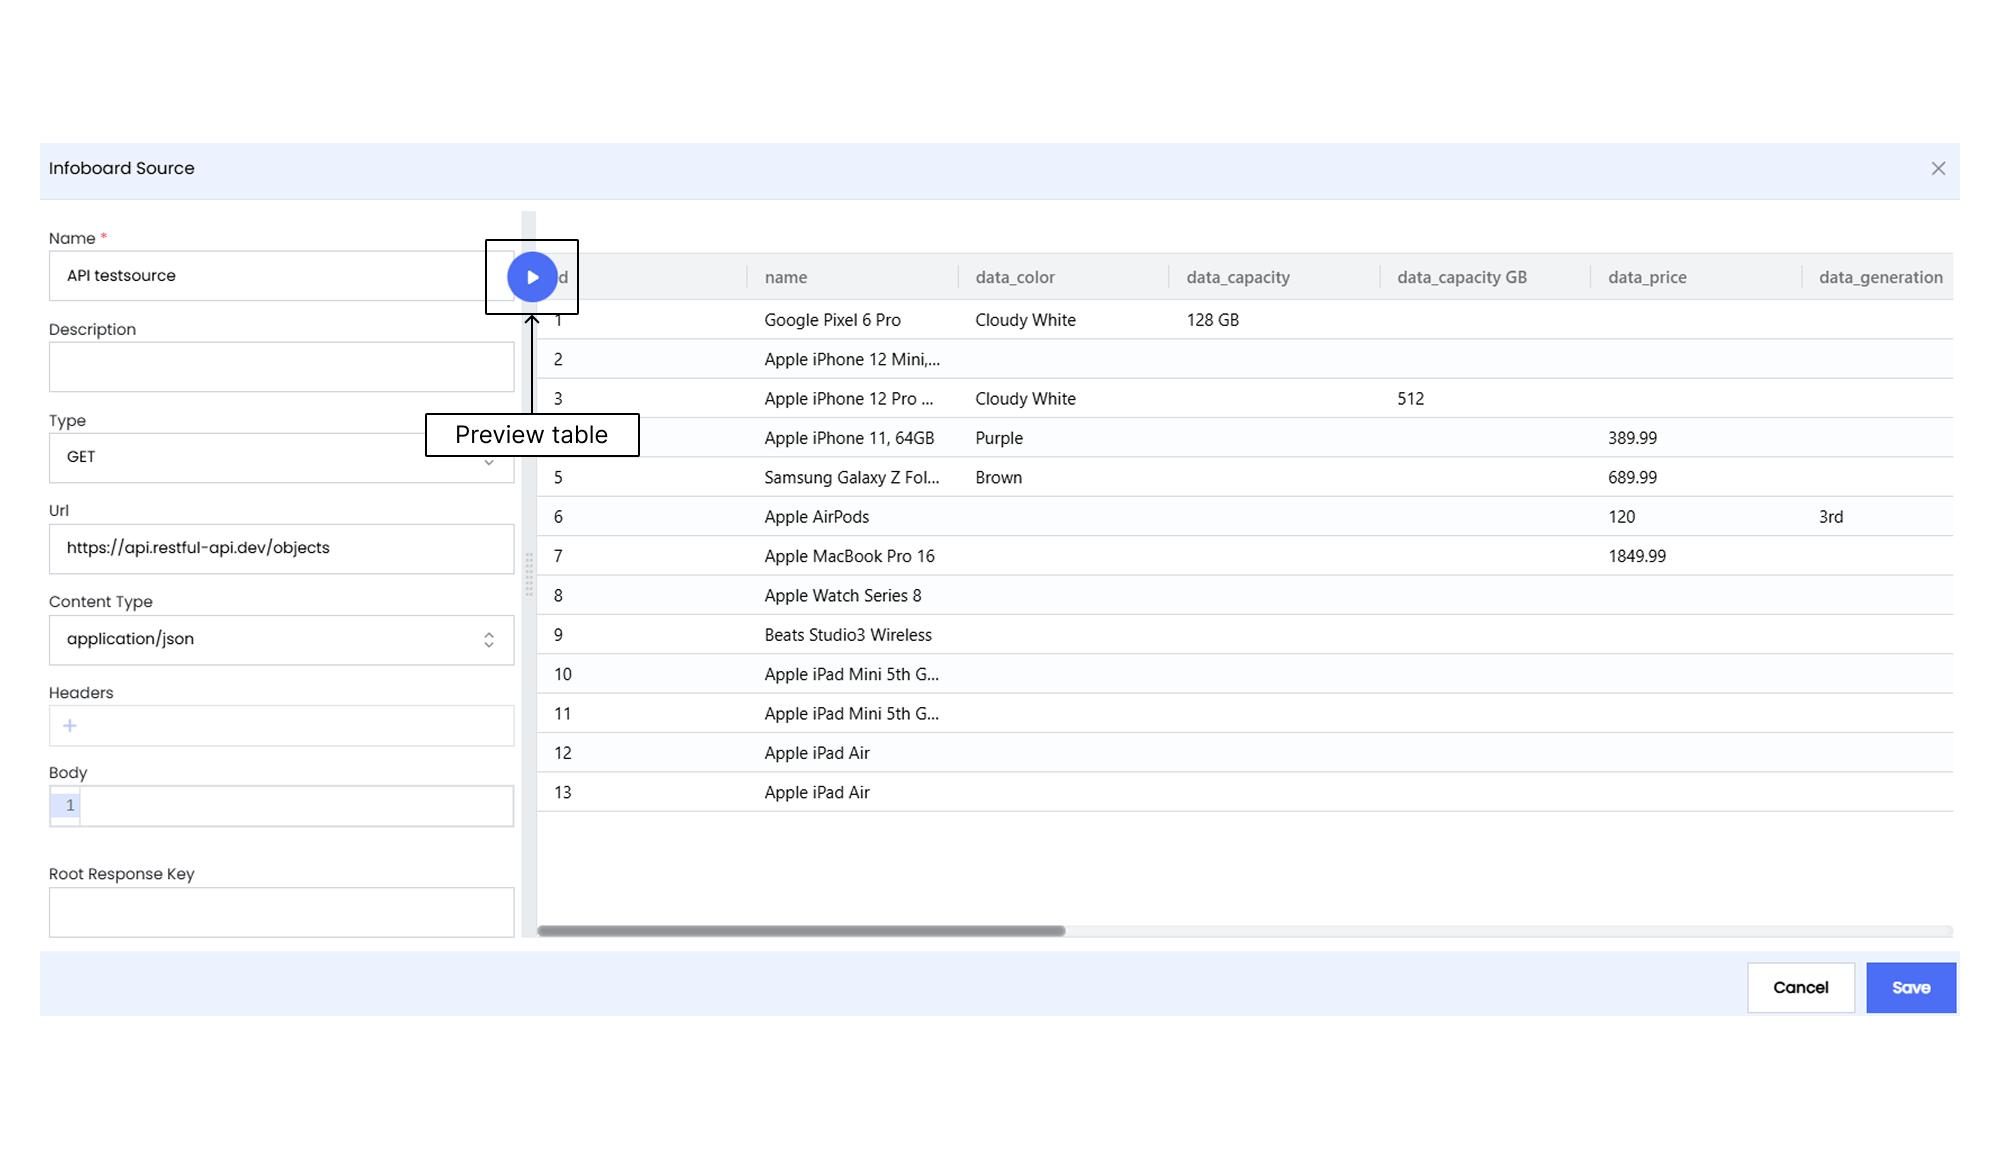
API Datasource
This section provides detailed guidance and instructions on how to create a Datasource directly from an API. You follow the steps to set up API sources, configure HTTP request methods, enter the request URLs, define the headers and run the API.
You therefore learn how to incorporate data from APIs into your widgets.
Here is a step-by-step guide on how to effectively call an API for your Infoboard widgets.
-
Select Sources and click + Add New Source.
-
Click Use API.
-
Name the source.
-
Choose the request method (GET or POST).
-
Enter the API URL.
-
Select content type (
jsonorform-url-encoded). -
Click Headers to add headers (e.g., Authorization).
-
For each header, define a name/key and a corresponding value.The name/key typically represents the type of information, like “Authorization” or “Content-Type.”
Authorization Header Often used for authentication, it might include a token or other credentials
Content-Type Header Specifies the format of the data being sent, such as “application/json” for JSON data.
The value is the specific data associated with that name/key.
-
Click + to add more headers.
-
Click the delete icon to remove a header.
-
If needed, add request body in JSON.
-
Add Auth info if needed (Auth URL, headers, client ID, secret).
-
Click Run to test the API.
-
Click Save.
To insert a new row using POST
- Use POST request type.
- Enter the URL.
- Add JSON in request body.
- Preview the table.
- Change to GET and preview again to confirm.
Code source
This section shows how to create an Infoboard source using JavaScript.
- Select Sources and click + Add New Source.
- Click Use Code.
- Name the source.
- Write JavaScript code.
- Click Preview Table.
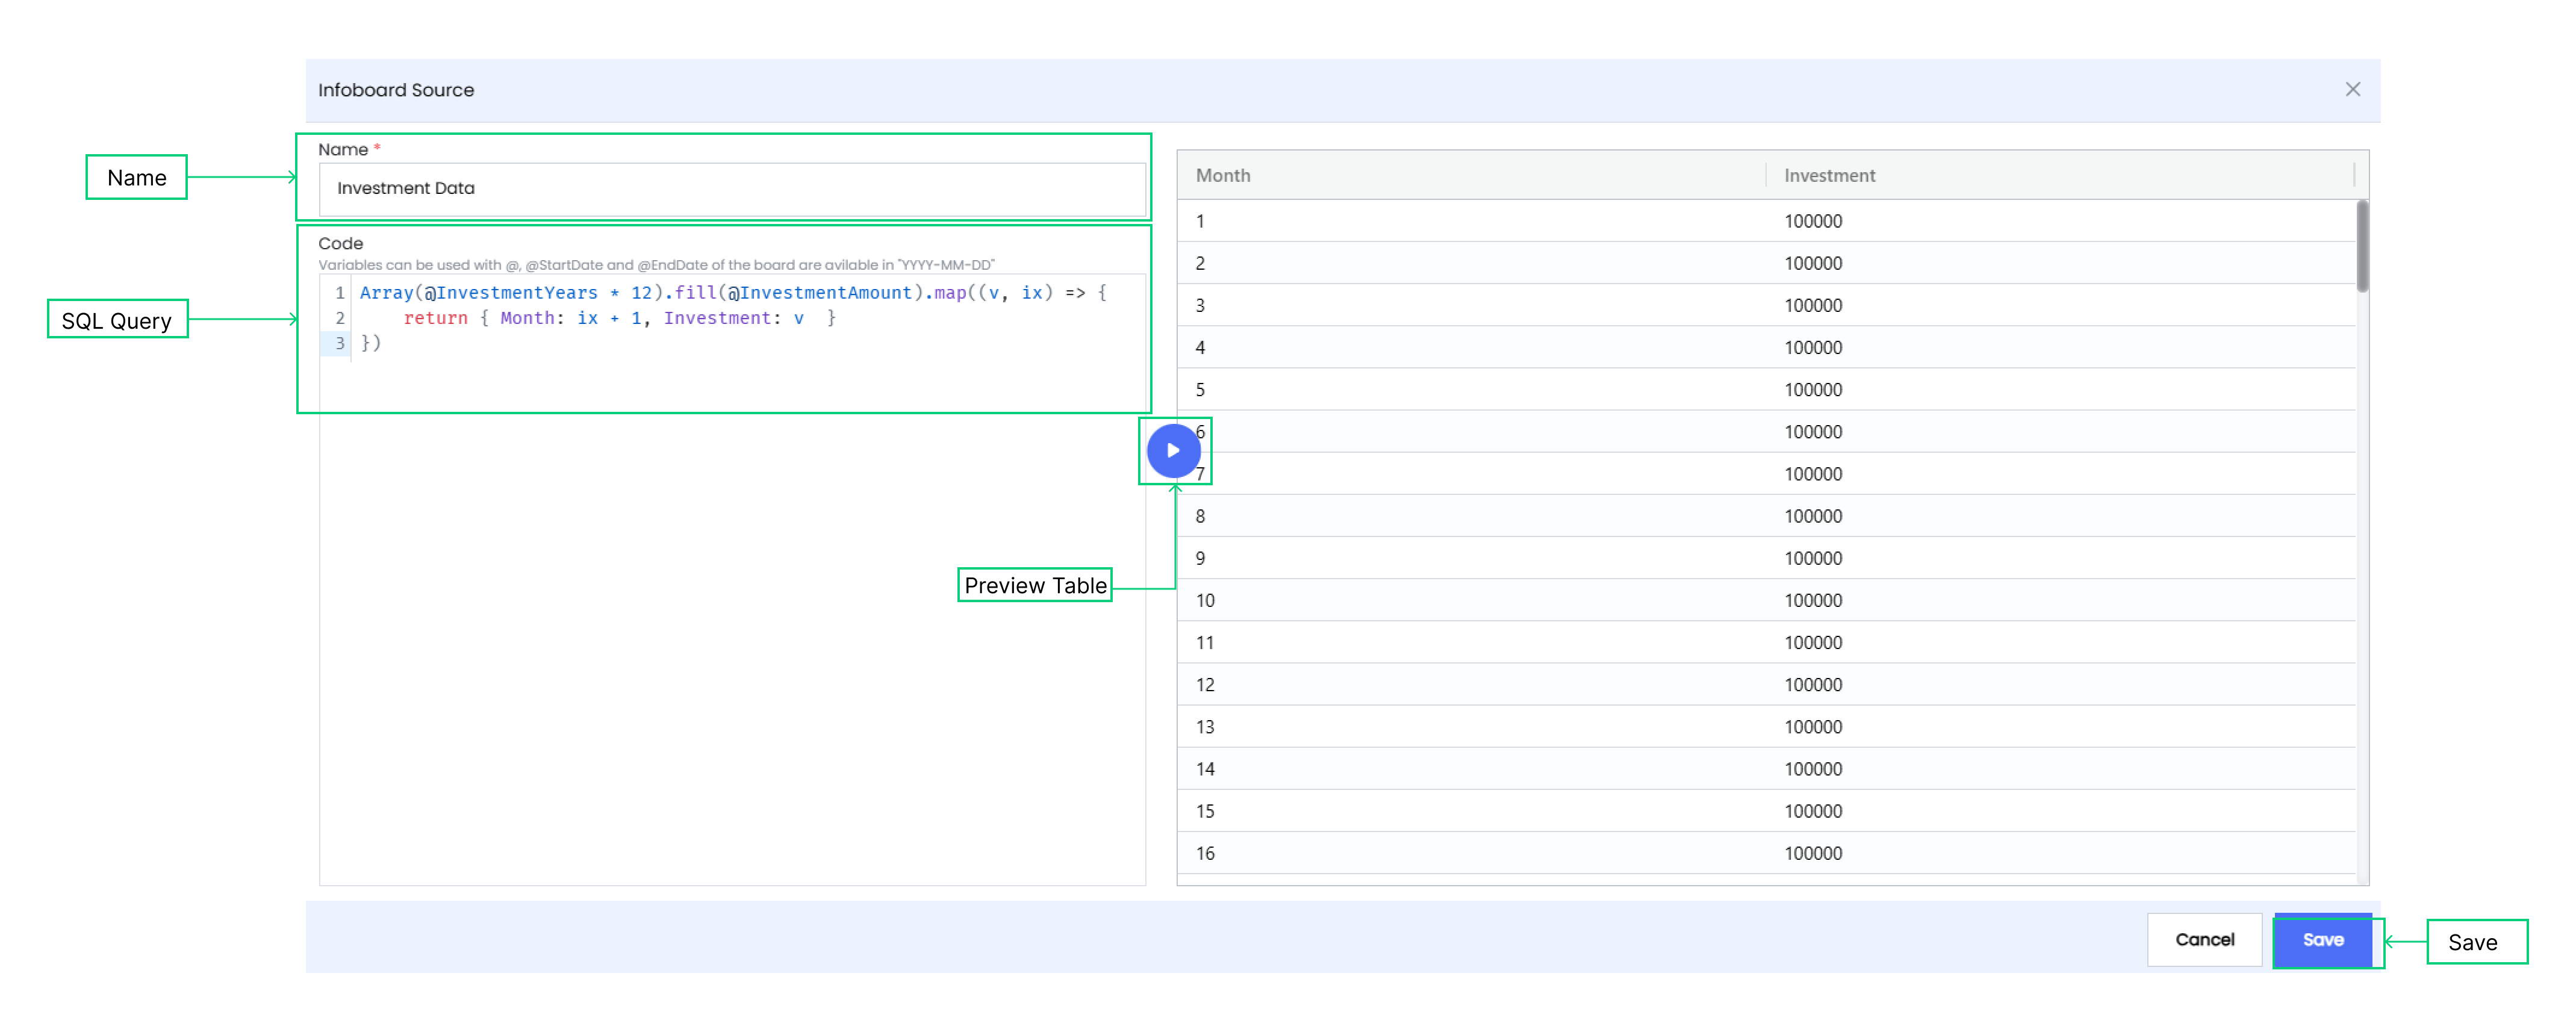
- Click Save.
Configuring an Infoboard
You can configure Infoboards under the Infoboard Setup tab in the Customize panel. This allows you to personalize the Infoboard name, define the date range (including options like years, quarters, months, weeks, or days), and selectively choose relevant workflows to tailor the Infoboard according to your specific needs.
Here are the key instructions for using the Infoboards section.
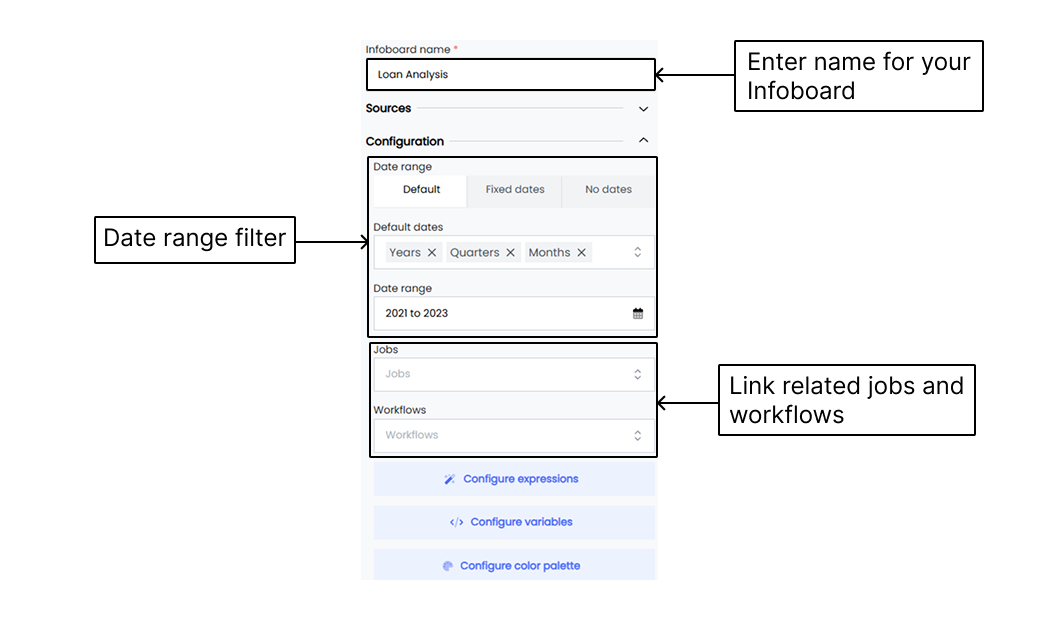
- Infoboard name
Enter a descriptive and meaningful name for your Infoboard. Choose a name that accurately reflects the purpose or content of the Infoboard. - Date range
Select the appropriate date range option for your Infoboard.- Default
Automatically determine the date range based on the available dataset. Choose from a range of options such as years, quarters, months, weeks, or days to define the default date range. - Fixed
Define a specific date range for the Infoboard, such as particular days, weeks, months, quarters, or years. - No Date
Use this option if your Infoboard does not require any date-related information.
- Default
- Select workflows and jobs
Use the dropdown to select the relevant workflows or jobs and link them with the Infoboard. The Infoboard displays the linked workflows or jobs execution status at the top-right corner of the screen.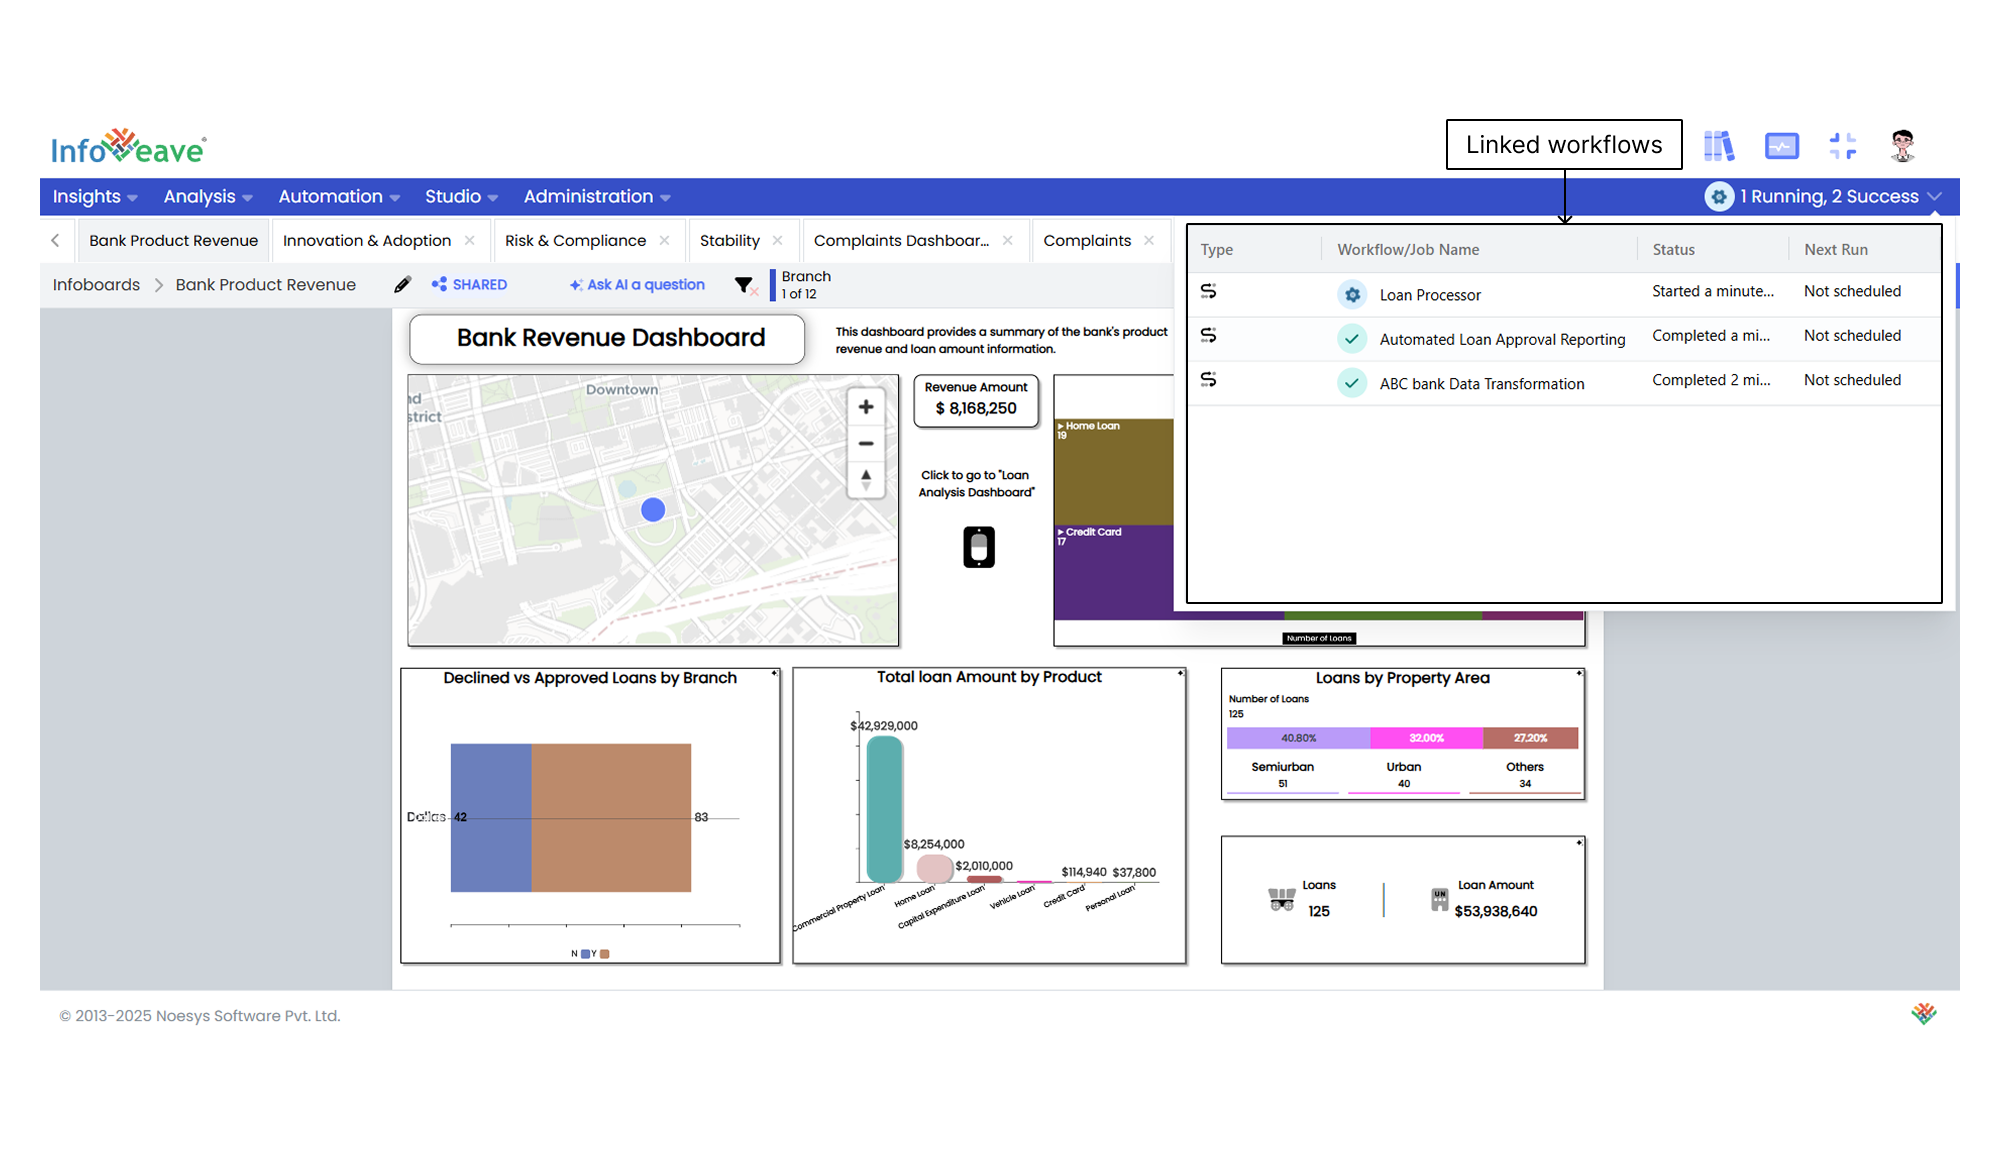
Configuring Expressions
Infoveave expression functions let you set up expressions for widgets on your Infoboard. This helps you create dynamic and customized data visualizations. You can perform calculations, set conditions, and apply formatting to your widget data using expressions.
Configuring Variables
Infoboard variables are dynamic components that help you define and create custom types of data inputs. You can use these variables in calculated columns for enhanced data analysis, custom calculations, and interactive Infoboards or simulations.
- Open the required Infoboard where you want to add variables and click on the Edit option.
- Go to the Infoboard Setup tab to access variable settings and options specific to the Infoboard.
- Click on the Configure variables button. You can find this inside the Configuration option. This opens the variable modal where you can define and manage your variables.
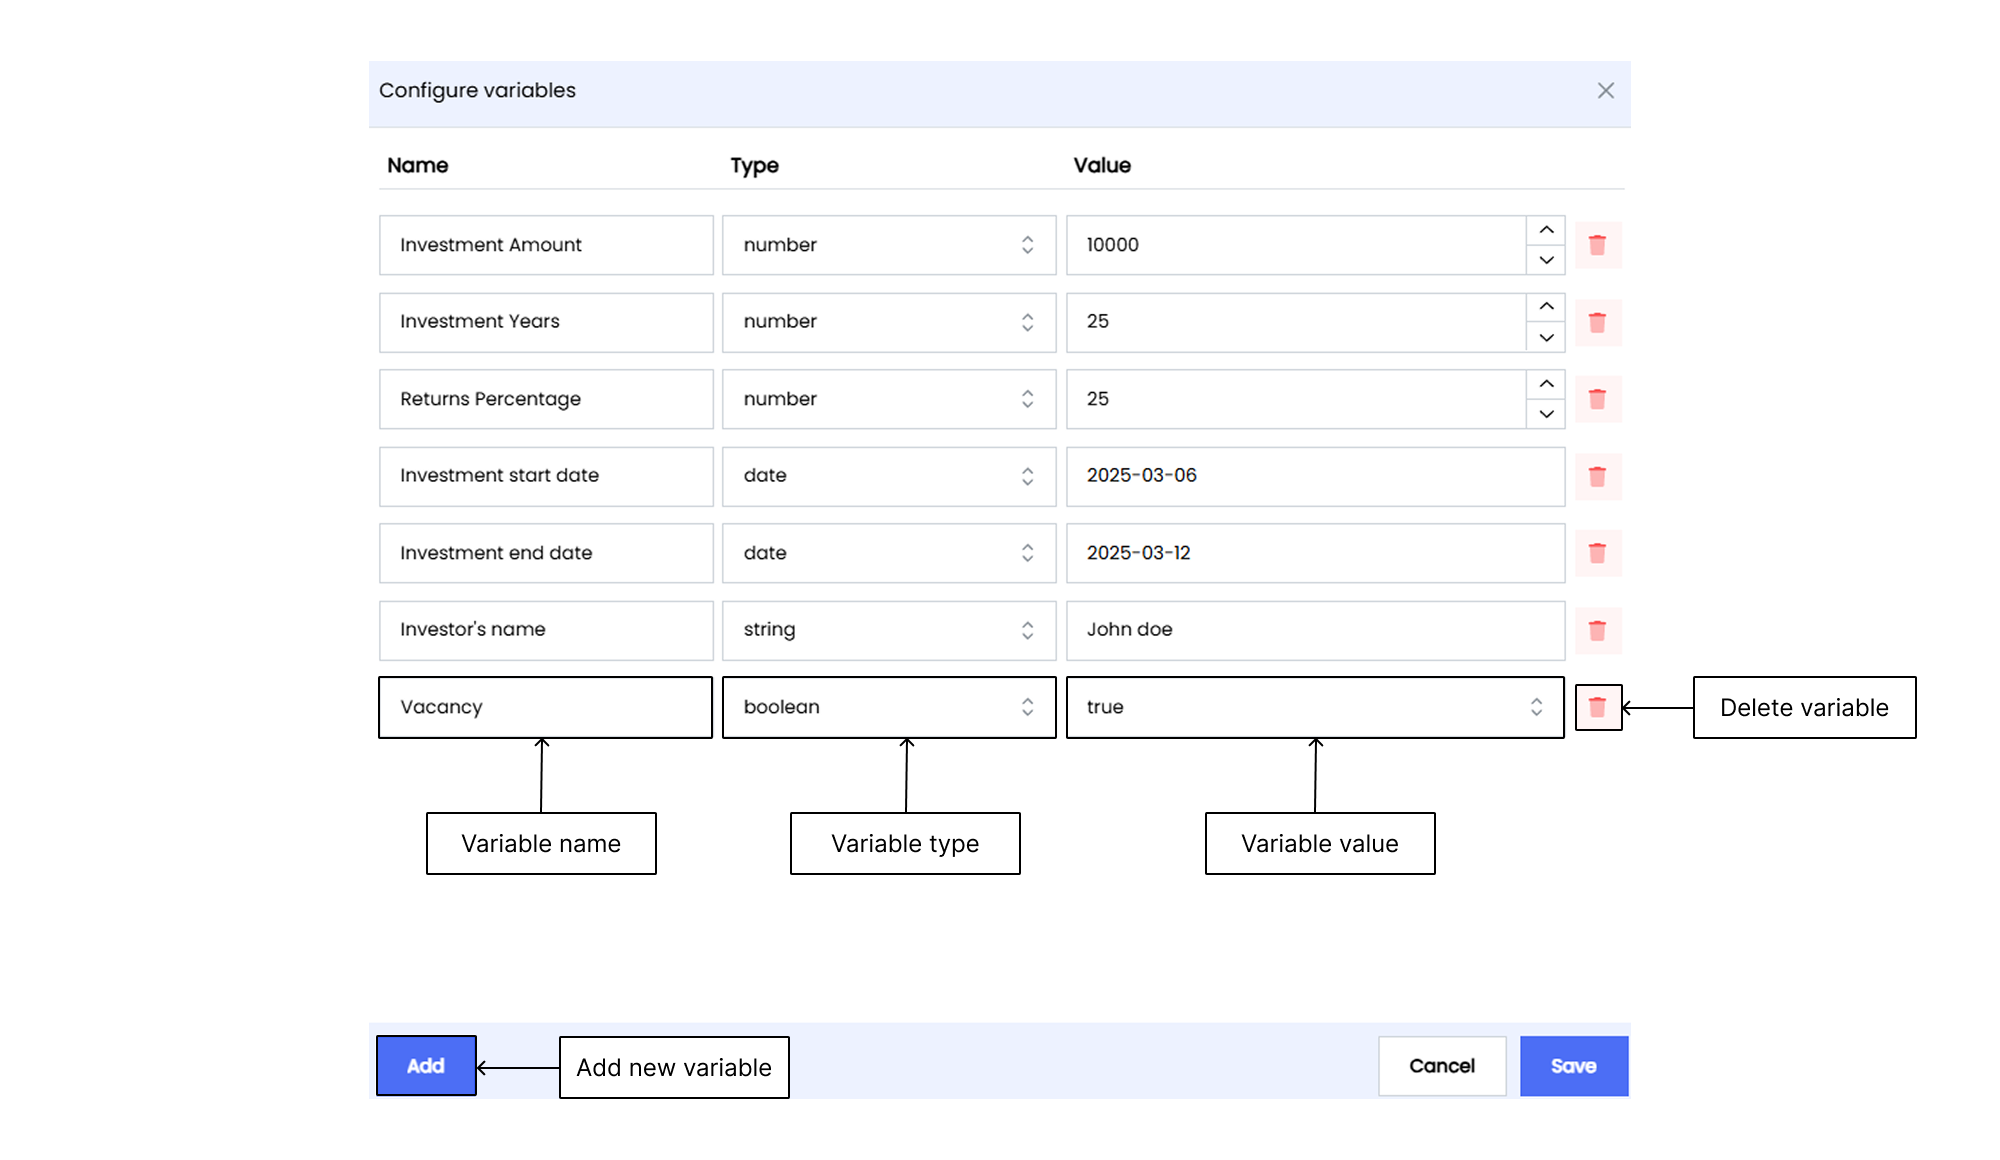
- In the variable modal, click on the Add button to begin creating a new variable.
- Enter a descriptive name for the variable. This name should indicate the purpose of the variable.
- Choose the appropriate type for your variable from the available options:
- Number for numerical values.
- Number[] for an array of numerical values.
- String for text-based values.
- String[] for an array of text-based values.
- Boolean for true or false values.
- Boolean[] for an array of true or false values.
- Date for date values.
- Date[] for an array of date values.
- Based on the selected variable type, input the value:
- For a Boolean variable, select either true or false.
- For a Date variable, use the calendar picker to choose a date.
- For a Number variable, enter the numerical value directly.
- For a String variable, enter the required text.
- After you define the variable and its value, click on the Save button to add it to your Infoboard setup.
- To delete a variable, click on the associated Delete icon.
Configuring the Color Palette
The Infoveave color palette lets you customize the appearance of your data. You can assign specific colors and icons to individual dimensions and measures. This improves readability and ensures consistent visual representation across all widgets in the Infoboard.
Follow these steps to configure a color palette.
- Open the Infoboard where you want to add a color palette and click on the Edit option.
- Go to the Infoboard Setup tab under the Customize panel to access color palette options.
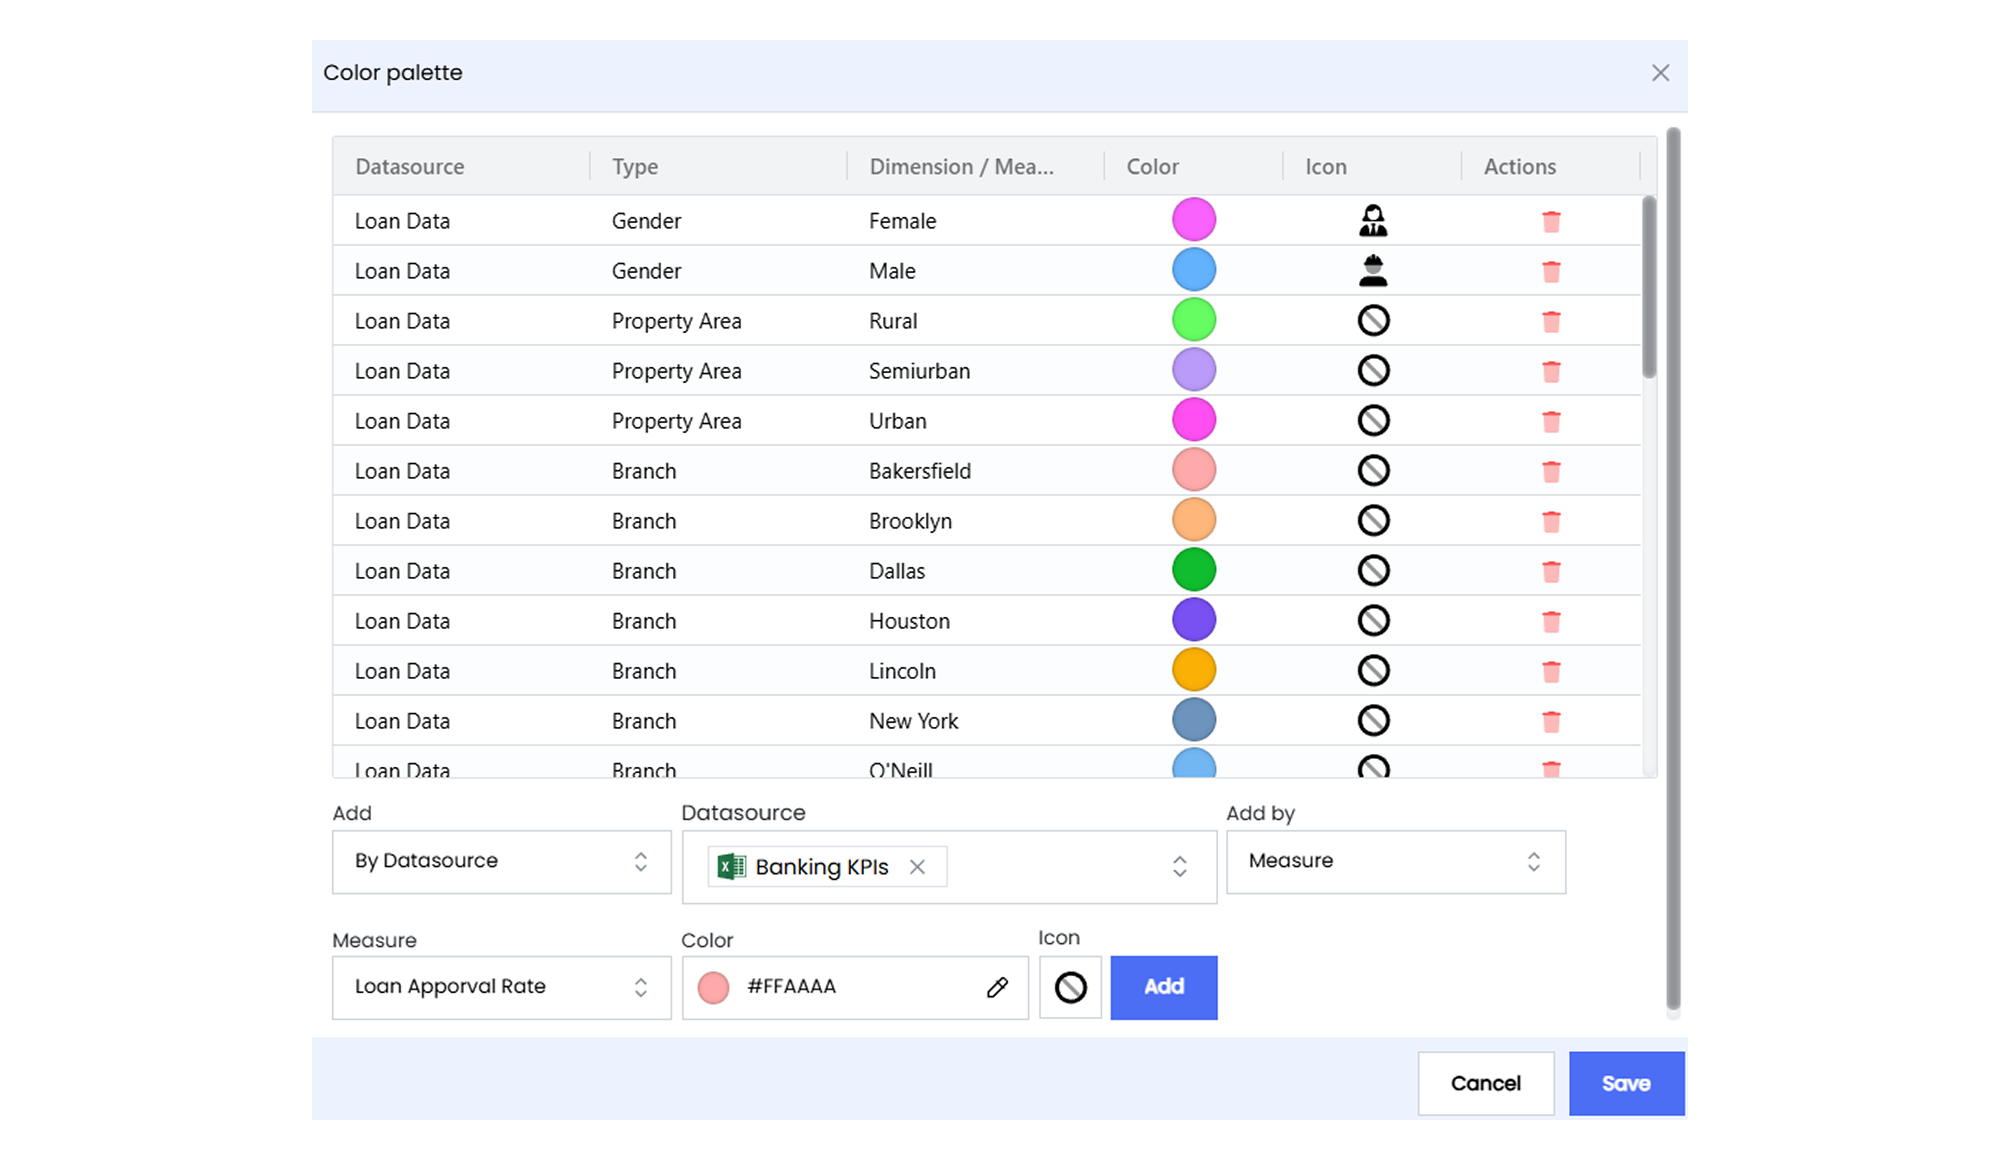
- Under the Configuration option, click on the Configure color palette button. This opens a modal where you can define colors and icons for specific dimensions or measures. You can also view existing palettes.
- Choose the required Datasource from the available list.
- Select either Dimension or Measure from the Add by options.
- Pick the dimension or measure for which you want to define a color.
- Select the specific item to which you want to assign a color and icon.
- Select the desired icon from the Infoveave icon library.
- Pick a color using the color picker or enter a color code.
- Click on the Add button to assign the color and icon to the color palette.
To edit a color or icon assignment, find the dimension or measure in the color palette modal.
![]()
To change a color, click on the existing color and choose a new one.
To change an icon, click on the icon and select a new one from the Infoveave icon library.
Click on the Update button to save the changes.
Click on the Delete icon to remove a color palette assignment.
Click on the Save option to save all updates.
Common Dimension filters
Common dimension filters apply across an Infoboard when multiple sources share a common column or dimension. This helps you apply consistent filters and simplifies data analysis.
For example, if several sources in your Infoboard show sales KPIs and each includes a “Region” column, you can define “Region” as a common dimension. When you apply this filter, all related charts update accordingly.
Follow these steps to set up a common dimension filter in Infoveave.
- Select the Infoboard you want to edit and click on the Edit option.
- Go to the Infoboard Setup tab and click on Filters.
- Click on the Add Common Dimension button.
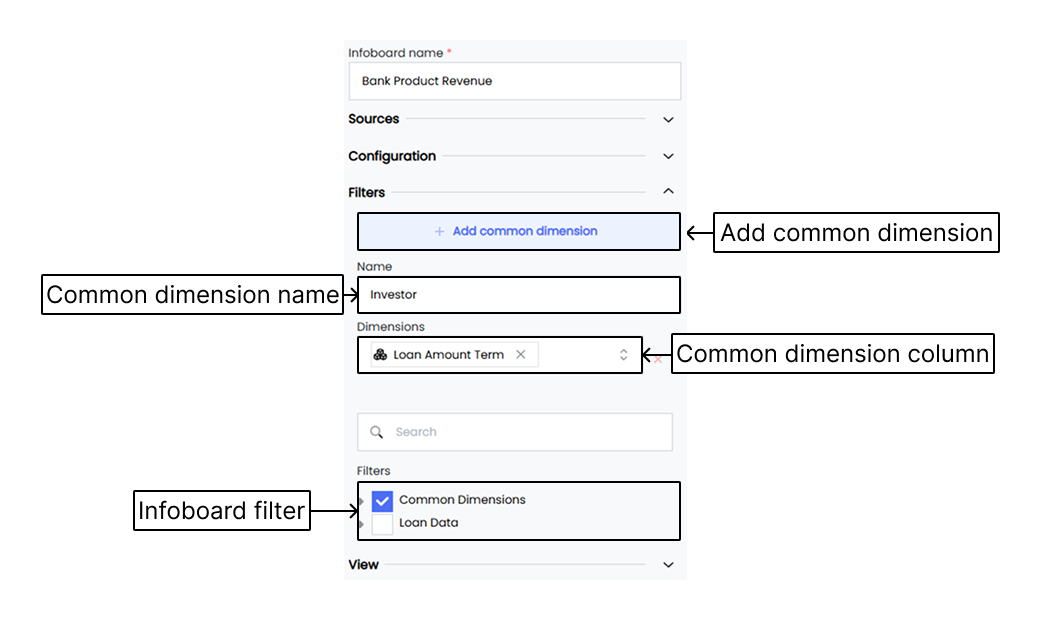
- Enter a name for your common dimension.
- Select the common dimension column from each Datasource and add them one by one.
- Check the box for the common dimension field to apply the filter to the entire Infoboard.
To learn about filtering data, visit Filtering Data
View
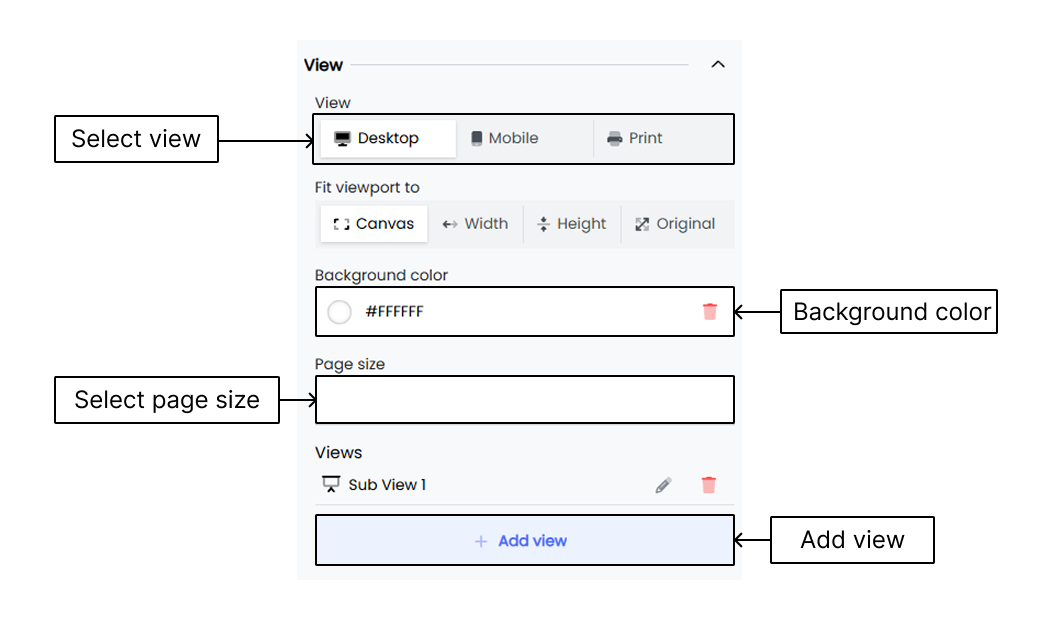
The View option in Infoboards allows you to set display sizes for desktop, mobile, and print views.
Setting background color of an Infoboard
- Under the Infoboard Setup tab, click on the View option.
- Set the background color using a hex color code.
- You can also use the color picker to select a color from the screen.
- Click on Save to apply the changes.
Page size
- Click on the View option.
- Select the page size for your Infoboard.
- The default page size is 16:9.
- Choose the 4:3 option if you need a different aspect ratio.
- Alternatively, select Custom to define a specific size.
- When you select Custom Size, extra fields appear.
- Enter the width and height for your Infoboard.
Views
The Views option lets you create subviews for your Infoboard. You can use this feature to focus on important information and highlight specific trends or widgets with more clarity.