
Progress Chart
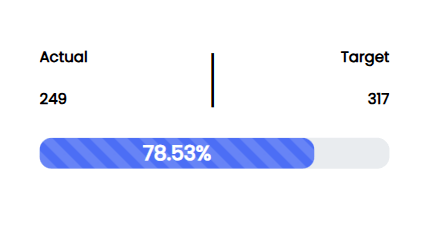
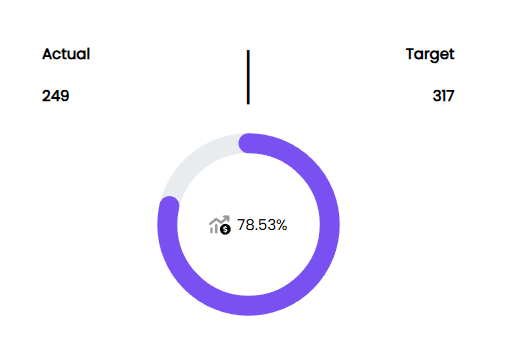
A progress widget helps track and display the progress of a activity or KPI towards the set goal over time. The progress chart offers a clear understanding of the target achieved over time, and a portion is left out. The progress widget can be in both linear and circular shapes, with the chart filling up proportionally with progress. A progress chart often compares two values- actual and target. Actual measures the current status or the amount of work that has been completed, and target is the goal or the total amount of work that needs to be completed.
Example Imagine you have a goal to read 100 pages of a book, with 40 pages read so far and 100 pages to read. The widget shows a bar or ring that’s 40% filled based on the progress widget type, indicating you’re 40% of the way to your goal.
Basic Configuration
Add and configure the required progress chart type in Infoveave with the simple drag-and-drop option. Select the Datasource, the associated measure and the dimensions required. Below are the simple steps on how to configure a progress chart in Infoveave.
- Drag the required progress chart type and drop it onto the designer workspace, from the chart library.
- Click on the progress chart in the designer to select it.
- With the progress chart selected, go to the Widget Configuration tab located in the Customize panel.
- Under the Configuration tab, select the Basic Configuration option to access the essential settings for the progress chart.
- Select the Datasource from Source which the chart will pull the data from the option.
- Choose the Measure(s) that represents the actual values you want to display on the progress chart.
- Choose the Measure(s) that represents the target values you want to display on the progress chart.
- Use the Date (optional) to include a date dimension in your chart, useful for showing trends over time.
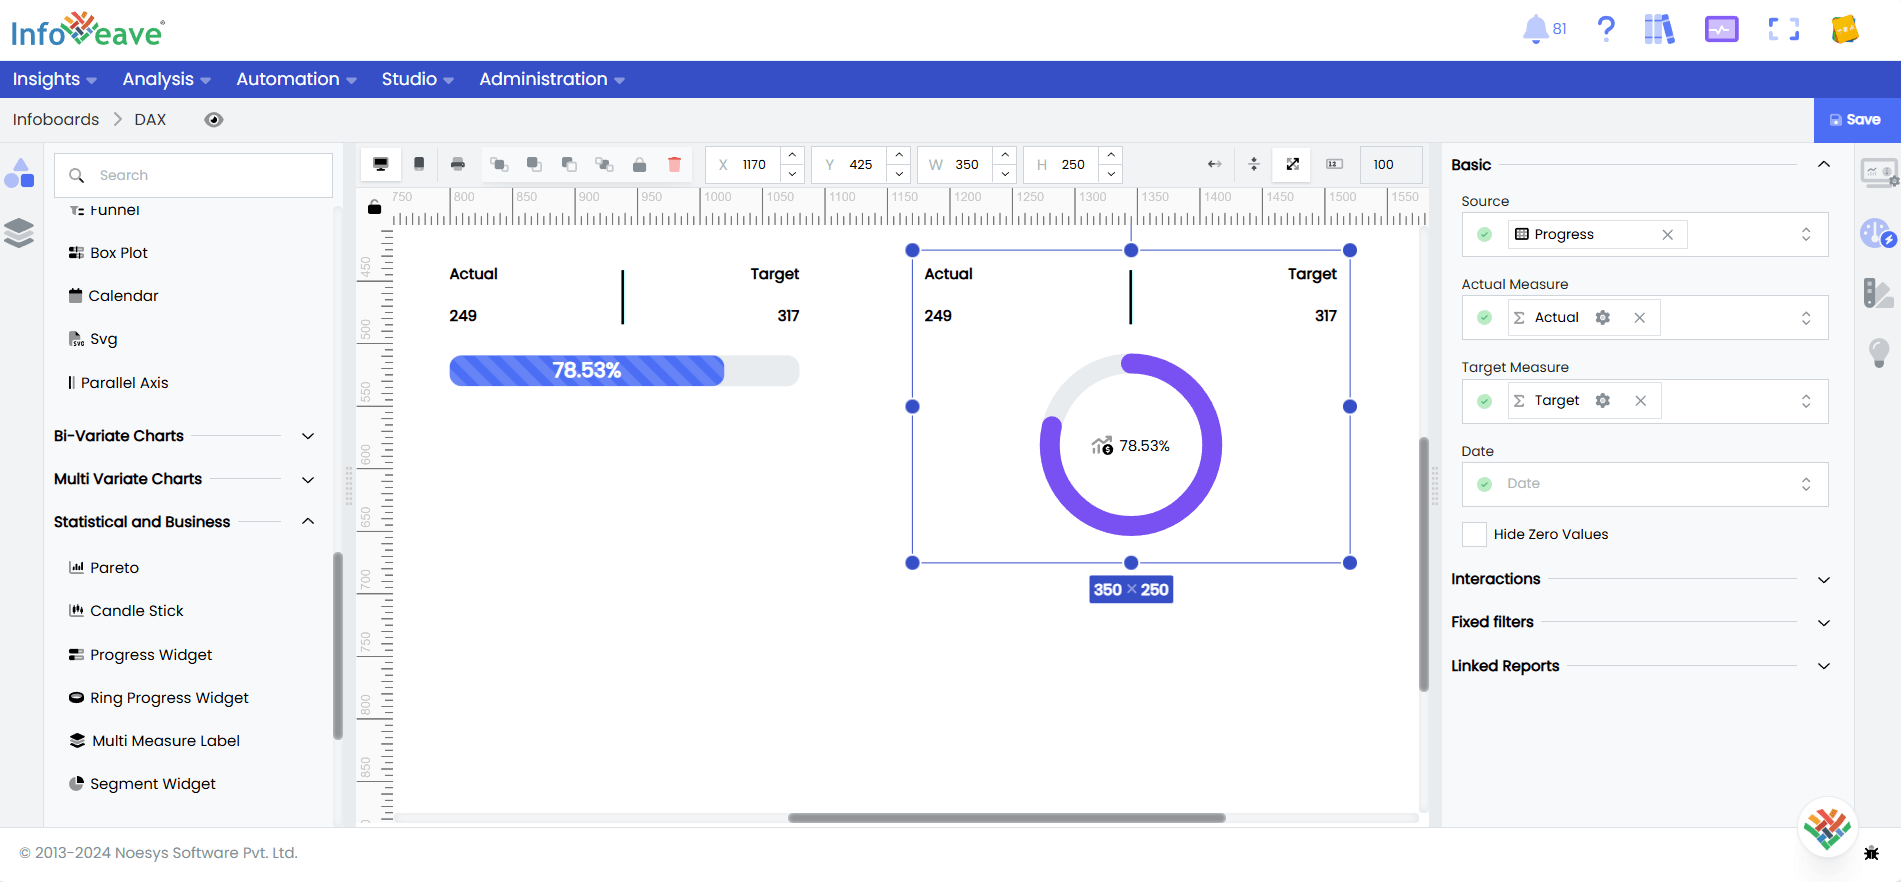
- Enable Hide Zero Values option (optional) to hide zero values.
Chart Customization
Customizing the progress chart allows you to tailor the widget appearance to meet your theme. With improved customization you can enhance the clarity on the data points, the chart aesthetics and set interactivity filters making your dashboard visually appealing also effectively communicating your data insights.
With the progress chart selected, go to the Widget Customization tab located in the Customize panel.
The basic customizations available for the progress chart are as below
- General Modify the chart’s general appearance, including the background color, borders, shadows, and drill-out choices.
- Title Enable and customize the chart title’s text, font, color, and alignment.
- Progress Additional options for customizing the progress ring, actual and target measure labels, and separators.