Chord
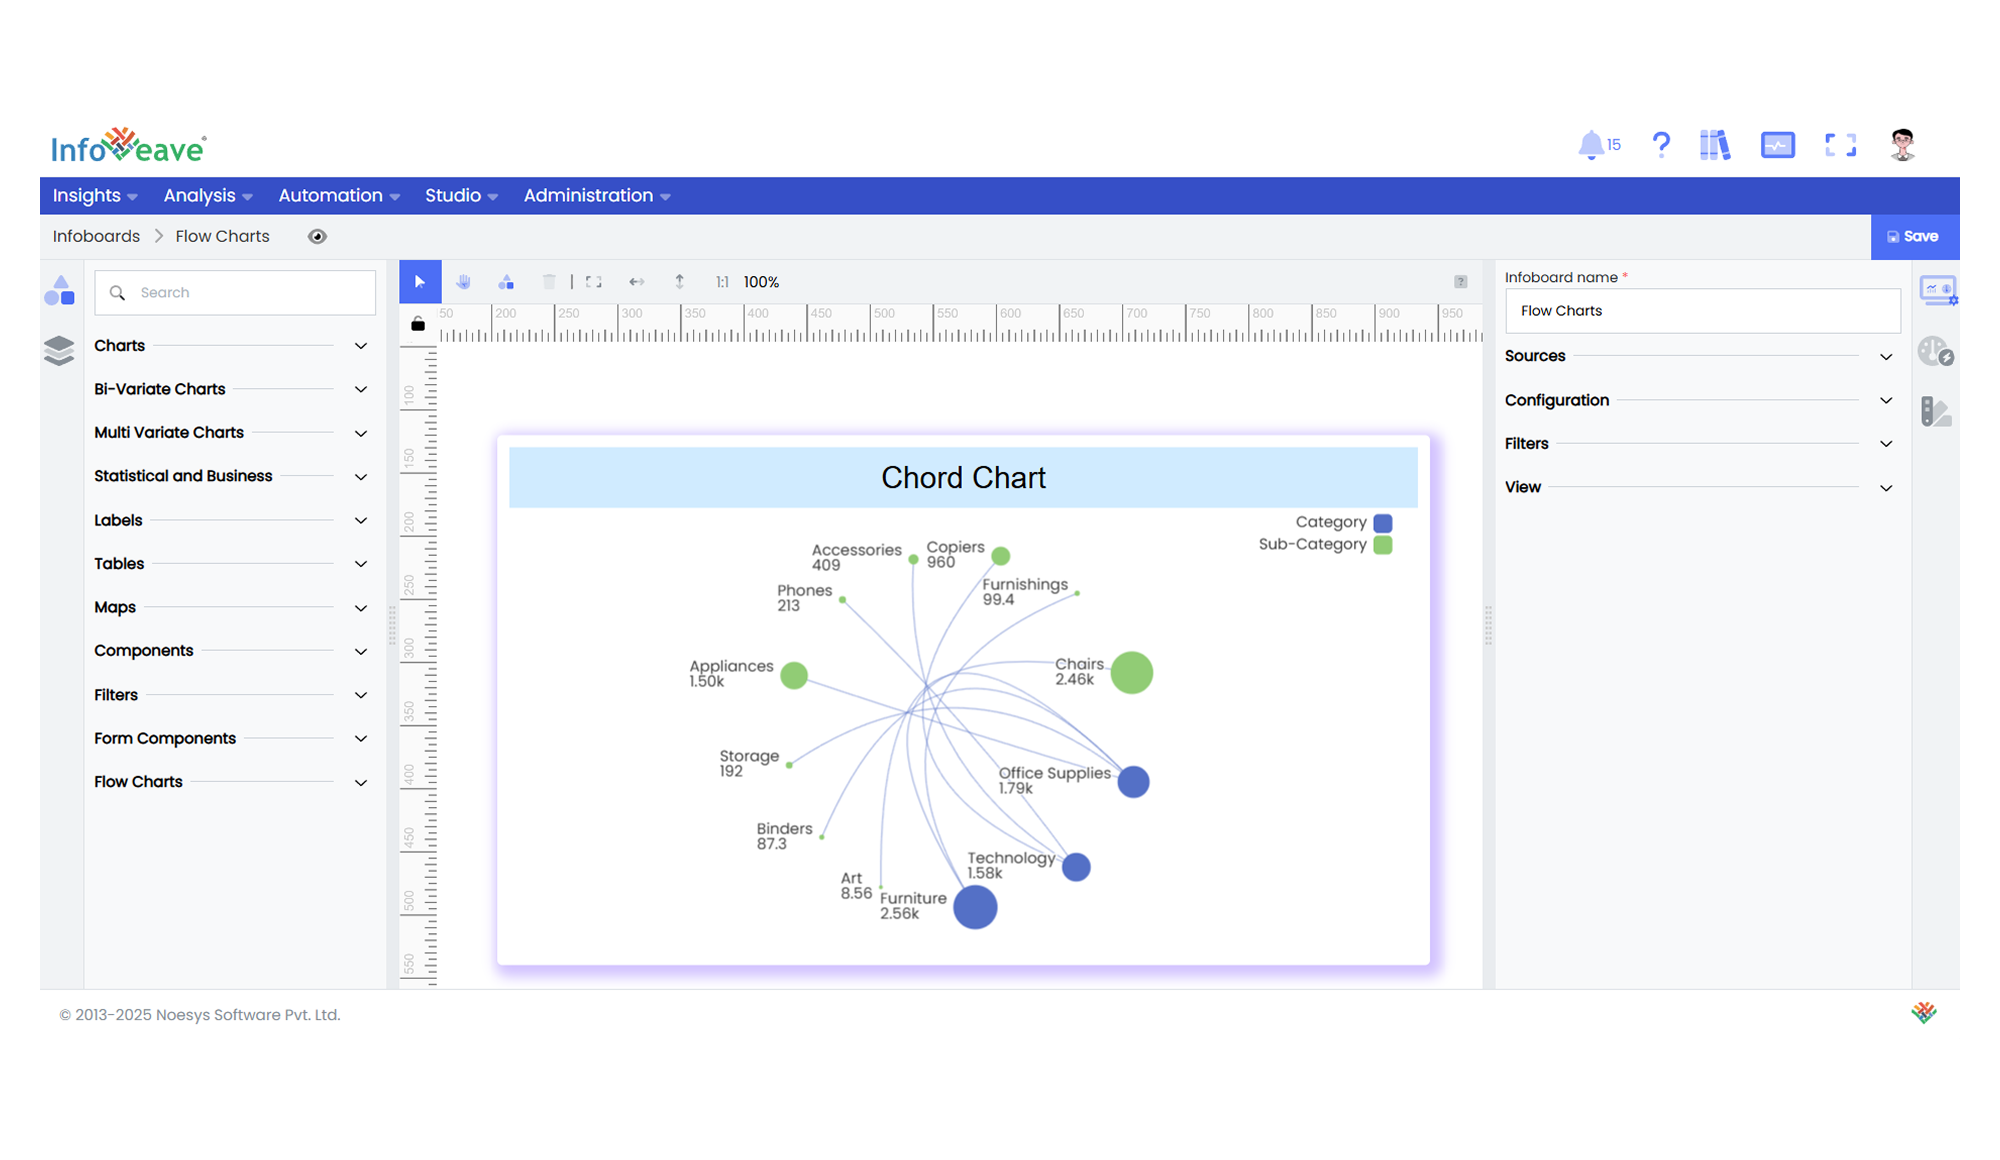
The Chord Chart is a specialized diagram used to display the inter-relationships between data categories.
Categories are arranged around a circle, with curved lines or ribbons connecting them to visualize the strength and flow of relationships between paired dimensions.
Use cases:
- Visualizing relationships or flows between categories.
- Showing network structures or cross-dimensional connections.
- Comparing interdependent quantities across multiple categories.
⚙️ Setup
- Drag the Chord Chart widget from the chart library onto your designer workspace.
- Select the chart.
- Go to the Widget Configuration tab in the Configuration panel.
- Under the Configuration panel tab, select the Basic Configuration option to access essential settings for the Chord Chart.
- Select the Source from which the chart will fetch its data.
- Map:
- Optionally add a Date field for time-based filtering.
📊 Basic Configuration
| Configuration Item | Description |
|---|---|
| Source | The data source to query for chart values. |
| Measure | Numeric value representing the size of connections between categories. |
| Dimension | At least two categorical dimensions used to create the relationships and groupings around the circle. |
| Date Field (optional) | Enables date-based filtering and drilldown capability. |
🎨 Chart Customizations
| Category | Options & Description |
|---|---|
| General | Theme, background, border, and interactivity options. |
| Title | Chart title, font, alignment, and visibility settings. |
| Sorting | Define custom sorting for dimensions and connection order. |
| Position | Adjust horizontal and vertical positioning of the chord within the chart. |
| Legend | Show/hide, position, and format for category legends. |
| Series | Customize node sizes, connection curviness, colors, labels, and positioning of the connections. |
| Tooltip | Tooltip content, format, and triggers for node and connection hover details. |
| Others | Configure symbol sizes, line curviness, connection colors (by Source or Target), and layout orientation. |
📊 Example Visualization