Multi Variate Line
The MultiVariate Line Chart is a powerful visualization designed to compare trends across multiple categorical dimensions on flexible grid layouts. It supports optional grouping, dynamic axis orientation, shadow styling, and heatmap overlays.
Key Features:
- Supports multiple categorical Axis dimensions.
- Optional Group dimension for multiple series lines within each axis.
- Configurable multi-grid layout with adjustable rows, columns, and margins.
- Dynamic line orientation (Horizontal / Vertical).
- Shadow and line styling controls.
- Optional heatmap visual map overlay.
- Rich tooltip customization and axis formatting.
- Drilldown interaction on data point click.
Use Cases:
- Trend comparisons across categories and groups.
- Multidimensional series visualization.
- Grid-based comparative analysis with different axis combinations.
⚙️ Setup
- Add a MultiVariate Line Chartwidget from the chart library onto your designer workspace.
- Select the chart.
- Go to the Widget Configuration tab in the Customize panel.
- Under the Configuration tab, select the Basic Configuration option to access the essential settings for the multi variate line chart.
- Select the Source which the chart will pull the data from the option.
- Map:
- Optionally add a Date field for time-based filtering.
- Enable Hide Zero Values to omit symbols with zero values if needed.
📊 Basic Configuration
| Configuration Item | Description |
|---|---|
| Source | Source providing the data for measures and dimensions. |
| Value | Numeric measure representing bar size. |
| Axis | One or more categorical fields for splitting grids. |
| Group (optional) | Additional dimension for grouped bars. |
🎨 Chart Customizations
| Category | Options & Description |
|---|---|
| General | Modify the chart’s general appearance, including the background color, borders, shadows, and drill-out choices. |
| Title | Enable and customize chart title text, alignment, font, and color. |
| Sorting | Define custom sort orders for categories along the X and Y axes. |
| Grid | Adjust chart margins, grid spacing, and padding around the matrix area. |
| Legend | Toggle visibility, position, orientation, and customize legend labels and icons. |
| HeatMap | Configure a visual color map to represent value intensity with a gradient. |
| Categorical Axis (X, Y) | Customize axis labels, intervals, rotation, visibility, and range sliders for both axes. |
| Numerical Axis | Value axis scaling, label formatting, log scales. |
| Series | Line color, symbols, line type, and width. |
| Tooltip | Control tooltip content, formatting, and visibility on hover. |
| Others | Orientation toggle (Horizontal / Vertical), line shadows. |
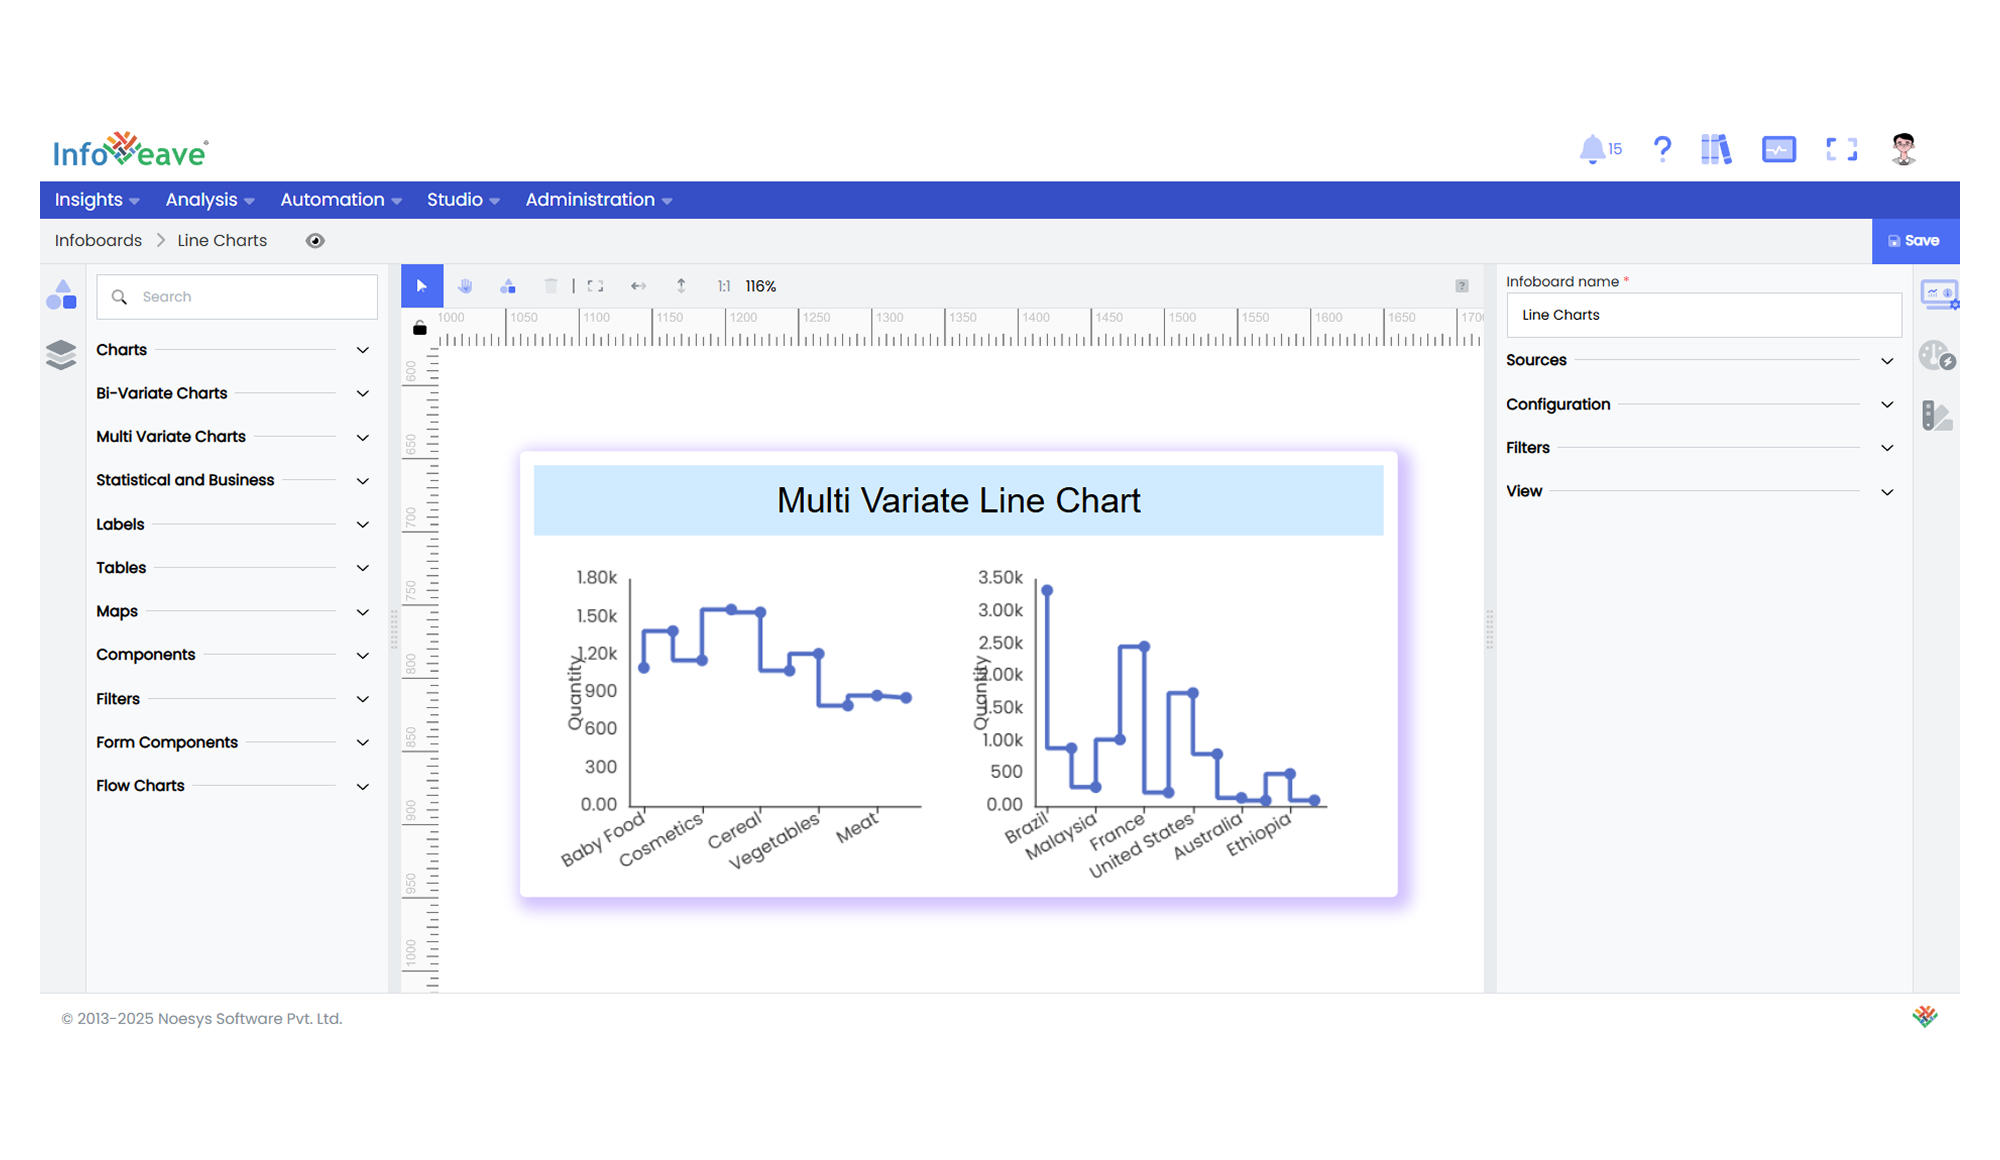
📊 Example Visualization