Bi-Variate Scatter
A BiVariate Scatter Chart visualizes two quantitative measures against each other in a multi-grid layout, optionally encoding a third quantitative variable as marker size.
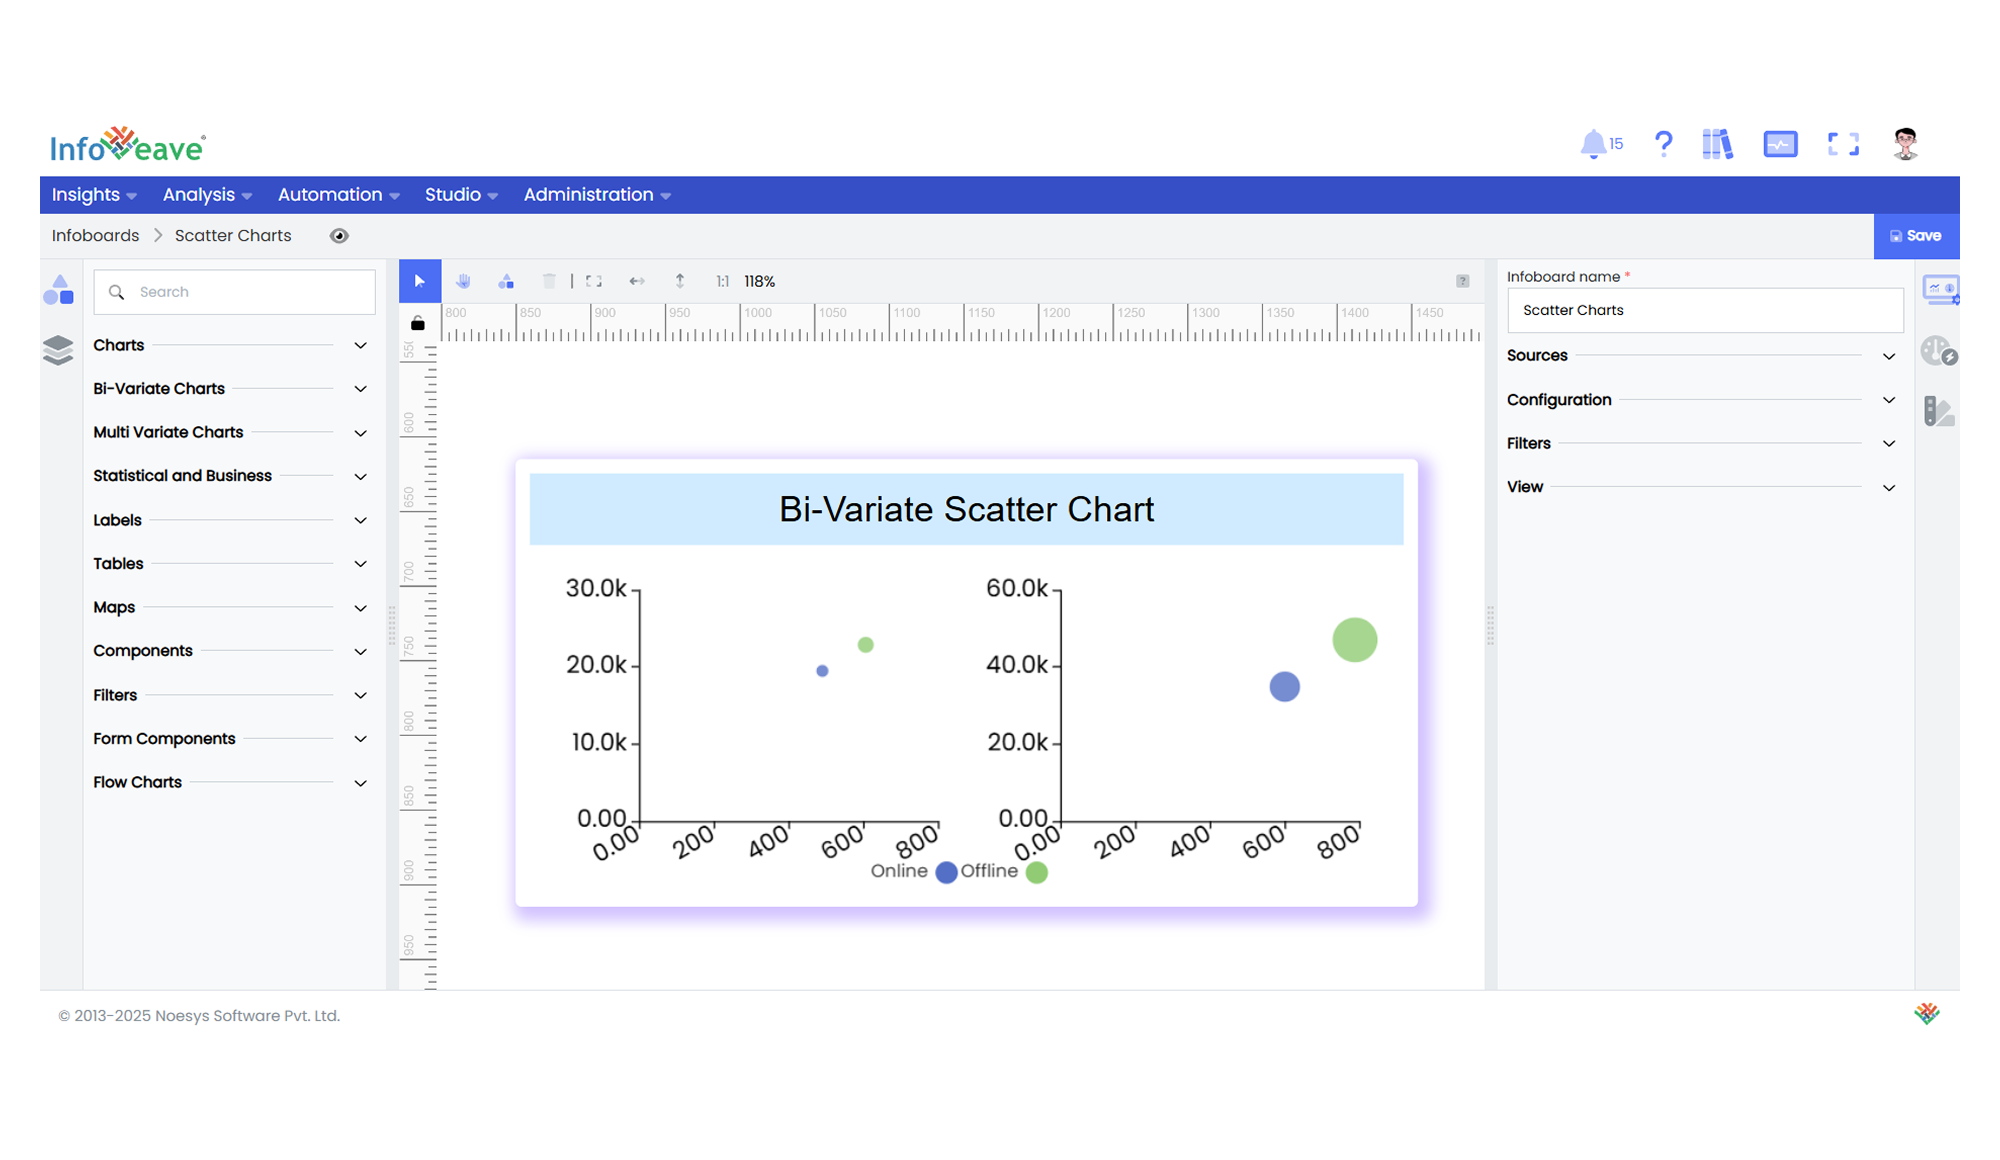
You can split the chart into multiple grids based on a Split dimension, and optionally group data points into series using a Group dimension.
Key Features:
- Multi-grid layout via Split dimension.
- Group series within each grid.
- Optional dynamic symbol size based on Size measure, X or Y axis values.
- Configurable box shadow effects on points.
- Supports log or linear scales for both axes.
- DataZoom (slider + inside) for axis zooming.
- Heatmap coloring via a VisualMap.
- Rich tooltips and legend customization.
- Responsive and accessible via ARIA.
Use Cases:
- Visualizing correlation between two measures across multiple categories.
- Bubble scatter trends by time periods, regions, or product types.
- Comparing sales vs. profitability with volume as bubble size.
- Outlier detection and multi-category analysis.
⚙️ Setup
- Add a BiVariate Scatter Chart widget from the chart library onto your designer workspace.
- Select the chart.
- Go to the Widget Configuration tab in the Customize panel.
- Under the Configuration tab, select the Basic Configuration option to access the essential settings for the bi variate scatter chart.
- Select the Source which the chart will pull the data from the option.
- Map:
- XAxis (Measure) — X-axis value.
- YAxis (Measure) — Y-axis value.
- Size (Measure) — (Optional) for bubble size.
- Split (Dimension) — Creates separate grids.
- Group (Dimension) — Series grouping within grids.
- Dimension (optional) — Additional label or data field.
- Optionally add a Date field for time-based filtering.
- Enable Hide Zero Values to omit symbols with zero values if needed.
📊 Basic Configuration
| Configuration Item | Description |
|---|---|
| Source | Source providing the data for measures and dimensions. |
| XAxis | Numeric measure for X-axis. |
| YAxis | Numeric measure for Y-axis. |
| Size (optional) | Numeric measure controlling bubble size. |
| Split | Splits chart into separate panels/grids. |
| Group | Series grouping within each grid. |
| Dimension (optional) | Label or category field attached to points. |
🎨 Chart Customizations
| Category | Options & Description |
|---|---|
| General | Modify the chart’s general appearance, including the background color, borders, shadows, and drill-out choices. |
| Title | Enable and customize chart title text, alignment, font, and color. |
| Sorting | Define custom sort orders for categories along the X and Y axes. |
| Grid | Adjust chart margins, grid spacing, and padding around the matrix area. |
| Legend | Toggle visibility, position, orientation, and customize legend labels and icons. |
| HeatMap | Configure a visual color map to represent value intensity with a gradient. |
| XAxis/YAxis | Numeric axis scales (linear/log), min/max, formatting. |
| Series | Marker shape, color, shadow effects. |
| Tooltip | Control tooltip content, formatting, and visibility on hover. |
| Others | Bubble Min/Max sizes, size source (Size/XAxis/YAxis), and Box Shadow settings. |
📊 Example Visualization