---
title: Creating Infoboard 
description: Learn to configure data sources, add widgets, and personalize your design for effective data visualization and reporting.
---
import { Aside,Steps } from '@astrojs/starlight/components';
import { MediaPlayerComponent } from "../../../../components/video-player";
import RunScript from "../../../../components/RunScript.astro";

# Creating Infoboard

## Creating an Infoboard Manually

This section guides you through selecting an existing Infoboard template to showcase your data or choosing a blank template to design your Infoboard from scratch.

### Selecting an Infoboard Template

<MediaPlayerComponent video="Create-Infoboards-Using-Design-Templates.mp4"
chapters={[
  {
    "start": 0,
    "end": 5,
    "text": "Create Infoboard ",
    "description": "From the Infoveave menu, click on Insights and click on Create Infoboard to begin creating a new infoboard."
  },

  {
    "start": 5,
    "end": 15,
    "text": "Preview a Template",
    "description": "A Select a template window will appear. Scroll through the available templates and click the magnifying glass icon next to Financial Insights Dashboard to preview it."
  },
  {
    "start": 15,
    "end": 31,
    "text": "Review Template Preview",
    "description": "Examine the interactive preview of the Financial Insights Dashboard template, observing its various charts and layouts. Close the preview once you're done."
  },
  {
    "start": 31,
    "end": 38,
    "text": "Select and Use Template",
    "description": "Back in the Select a template window, click Use this template for the Financial Insights Dashboard."
  },
  {
    "start": 38,
    "end": 49,
    "text": "Generate Infoboard from Datasource",
    "description": "A Generate Infoboard using Fovea dialog will appear. Select Finance datasource from the dropdown, then click Update Infoboard. The system will analyze your data and build the infoboard."
  },
  {
    "start": 49,
    "end": 61,
    "text": "Configure Bar Chart",
    "description": "On the newly generated Order Transactions Dashboard, click the bar chart titled Avg Sales vs Orders Trend. In the right-hand configuration panel, ensure Finance datasource is selected as the Source, Sales Amount for Value, Order Id for Size, and Mode Of Payment for Axis."
  },
  {
    "start": 61,
    "end": 126,
    "text": "Configure Multi-Measure Chart",
    "description": "Click the multi-measure chart on the right side of the dashboard. In its configuration panel, select Order Transactions Dashboard as the Source. For Value, choose Transaction ID. For Axis, select Mode of Payment. Then, in the General tab, enable the Title and change the Label to Transaction Distribution by Payment. Adjust the Font size to 26."
  },
  {
    "start": 126,
    "end": 142,
    "text": "Save Infoboard",
    "description": "Click the Save button in the top-right corner of the screen to save the Order Transactions Dashboard. A success notification will confirm the save."
  },
]
}
poster="/images/introduction-poster.png"
posterText="Creating Infoboards Using Design Templates"
client:load/>

Infoveave provides ready-to-use Infoboard templates that help you quickly start building an Infoboard aligned with your data storytelling goals.

Follow these steps to select a new Infoboard template from Insights.

<Steps>

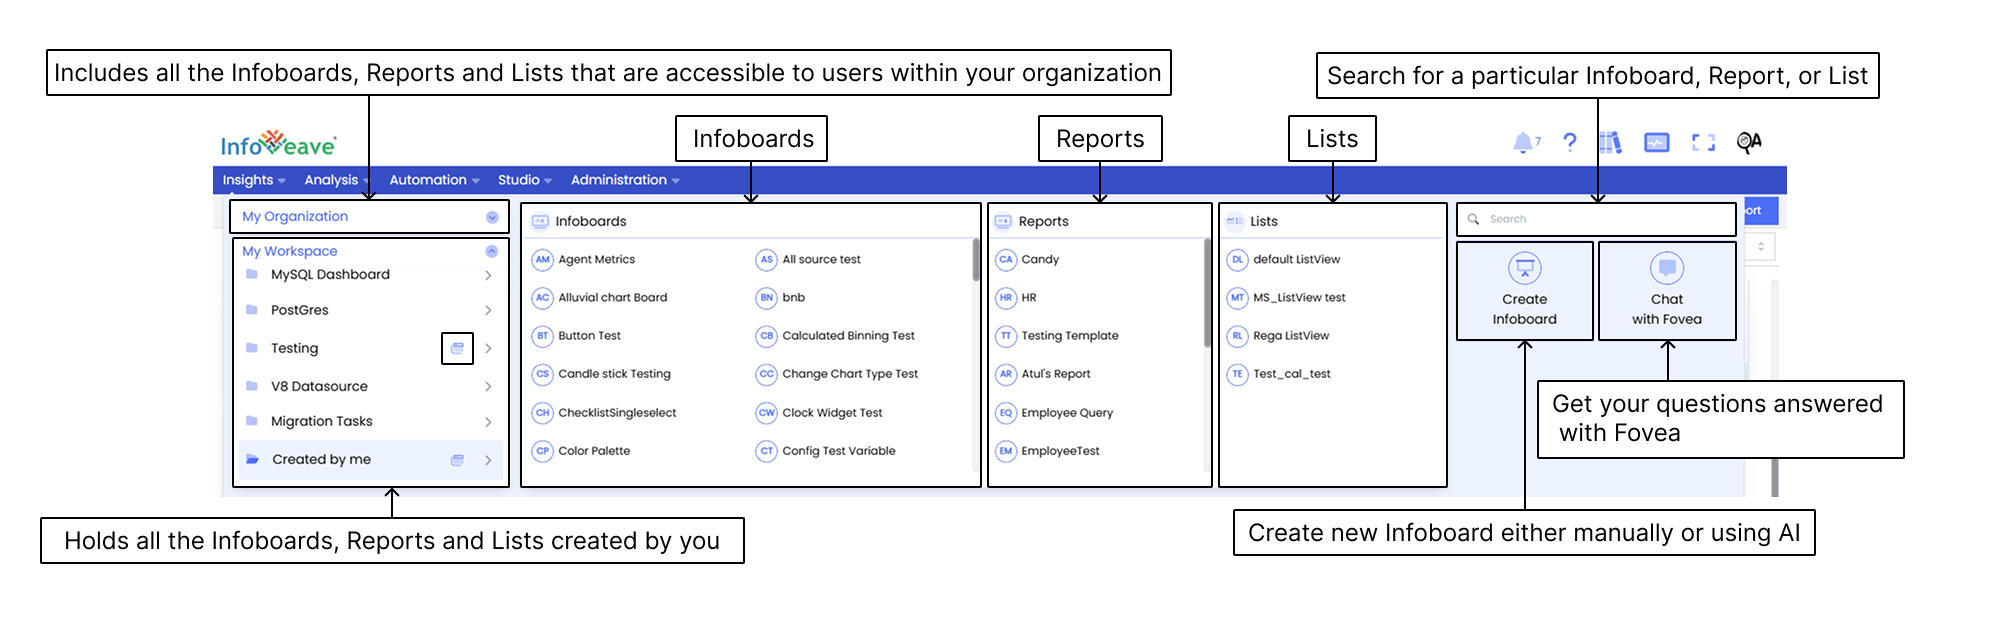
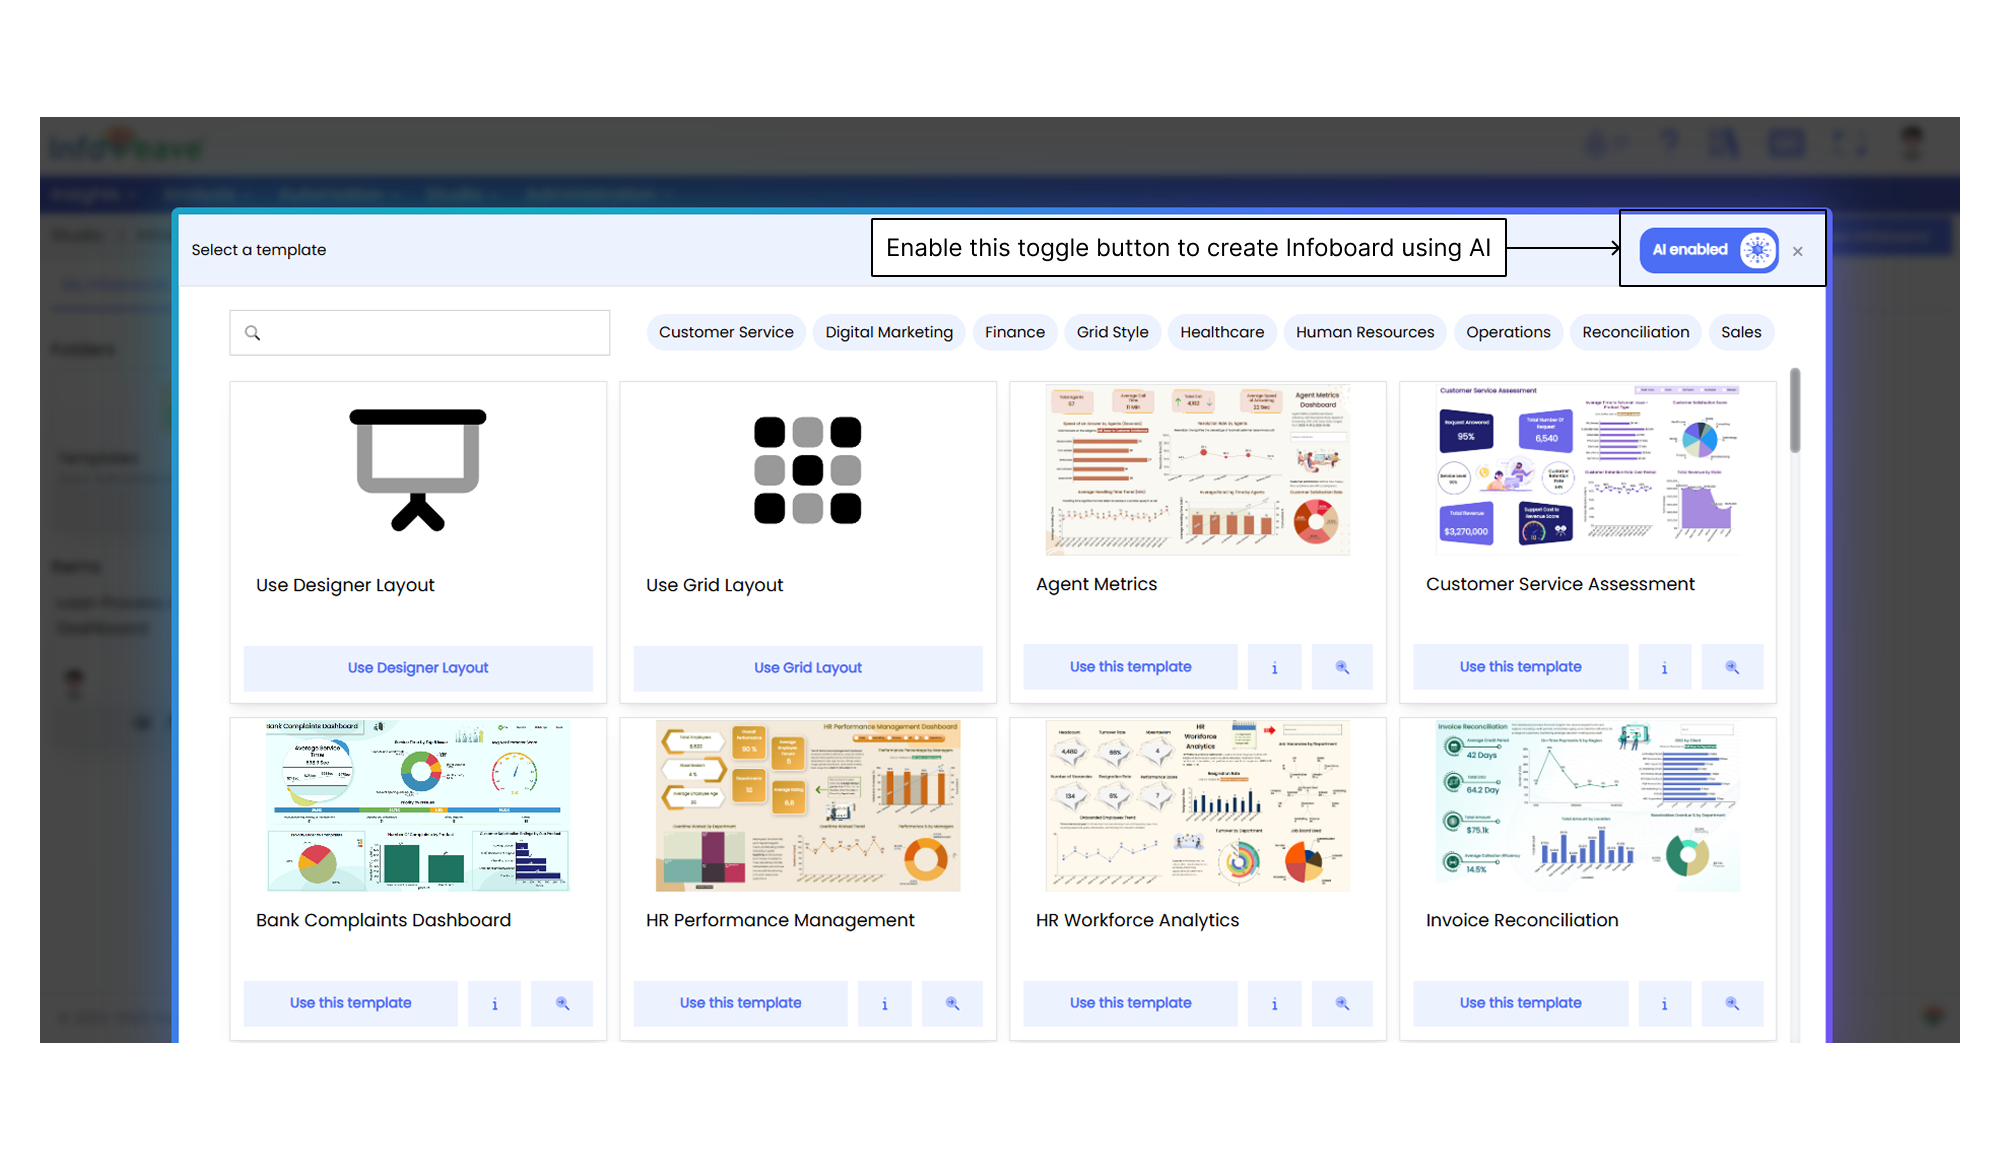
1. Click **Insights** from the Infoveave menu.  
2. Click **Create Infoboard** to open the collection of available templates.  
   ![Create Infoboard](/images/Insights/Infoboards/Creating-Infoboard/Insights.png)  
3. Browse through the templates organized by functionality.  
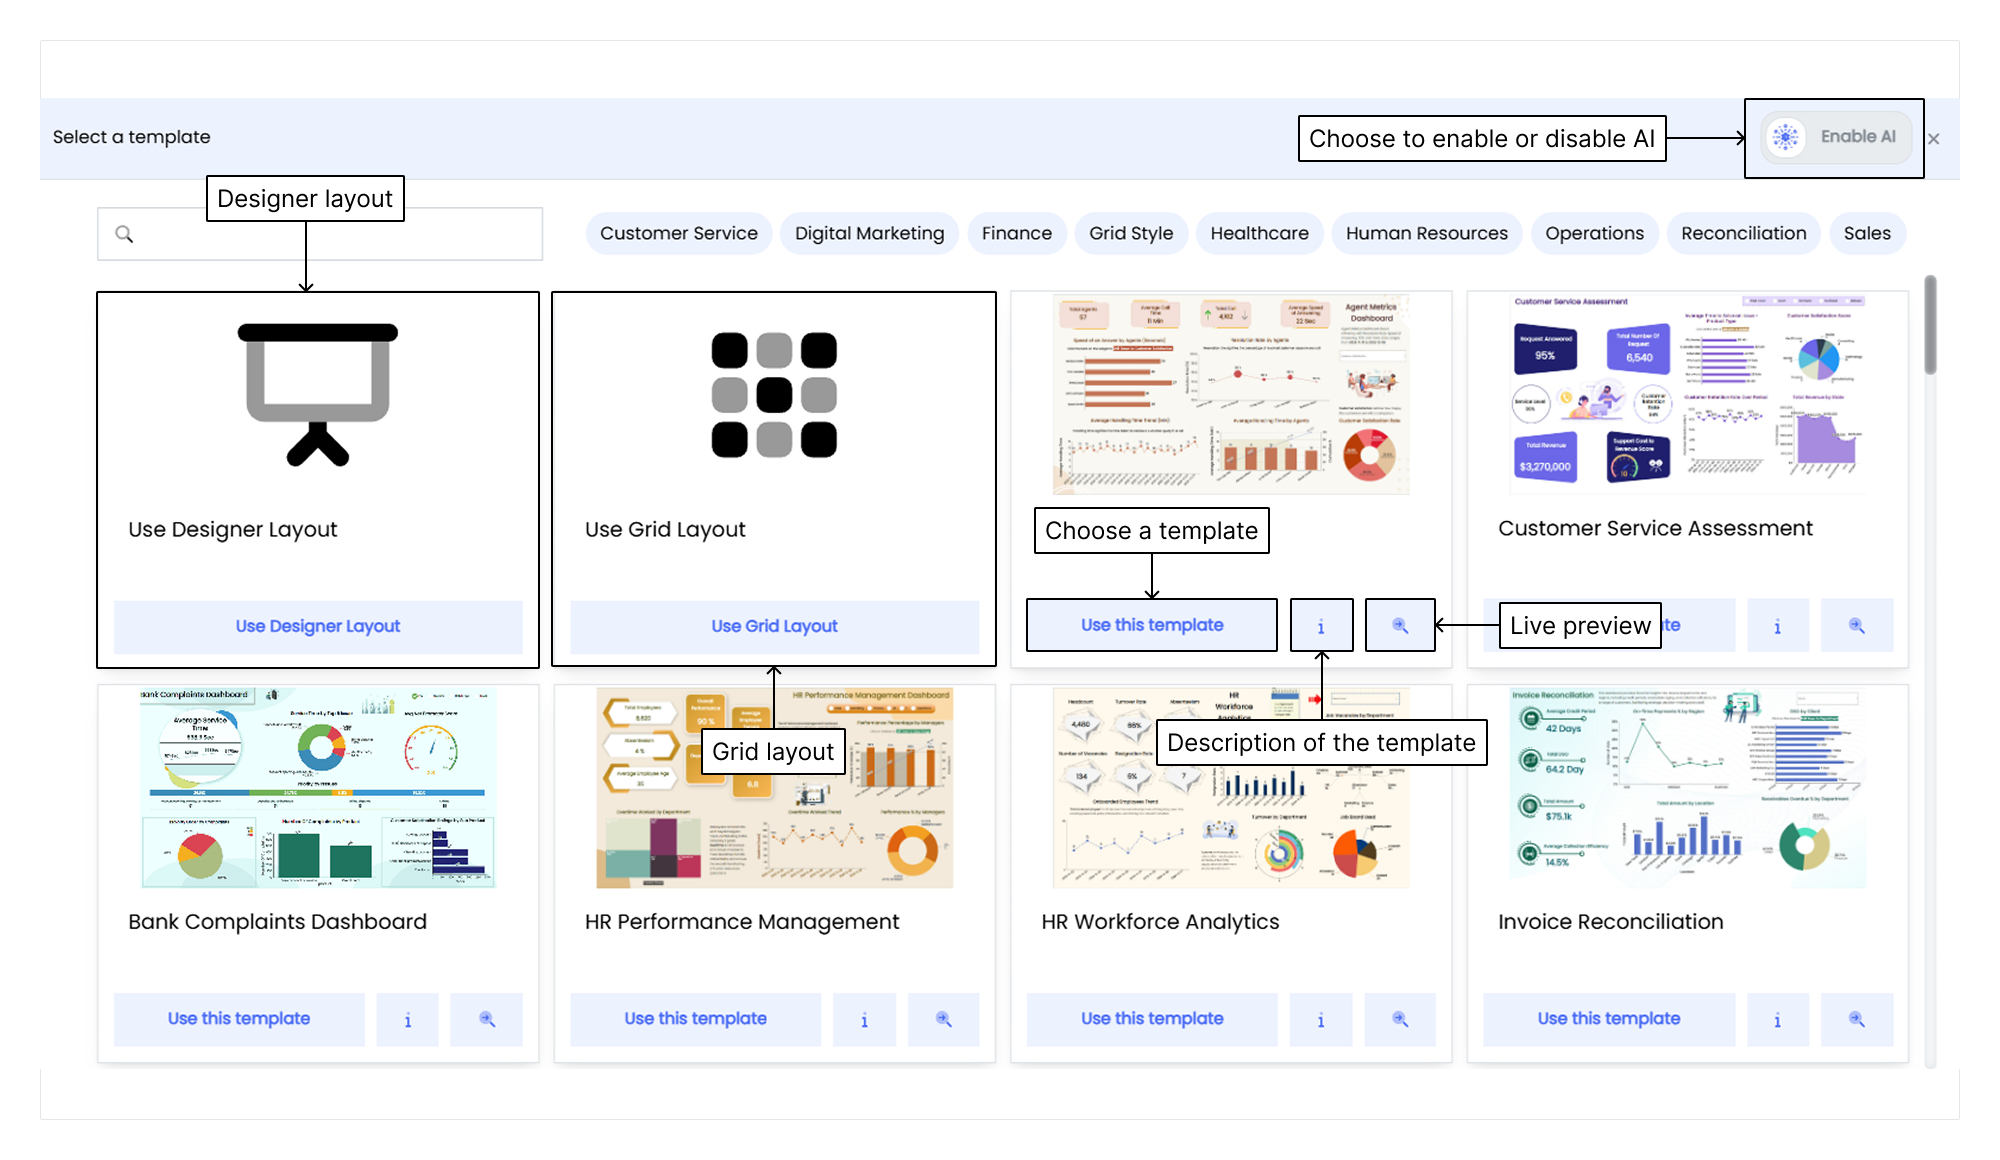
   ![Get Started with Templates](/images/Insights/Infoboards/Creating-Infoboard/Get-Started-with-Templates.png)  
4. Hover over the info icon <i class="fa-duotone fa-regular fa-circle-info"></i> to view the template description.  
5. Click the preview icon <i class="fa-duotone fa-regular fa-magnifying-glass-plus"></i> to see a live preview of the Infoboard.  
6. Click **Use this template** to set the chosen template as the base for your Infoboard.  
7. To start from scratch, choose between **Designer Layout** and **Grid Layout**.  
   - **Grid Layout** arranges widgets in a structured grid for neat alignment.  
   - **Designer Layout** lets you freely position and resize widgets and shapes for custom designs.  
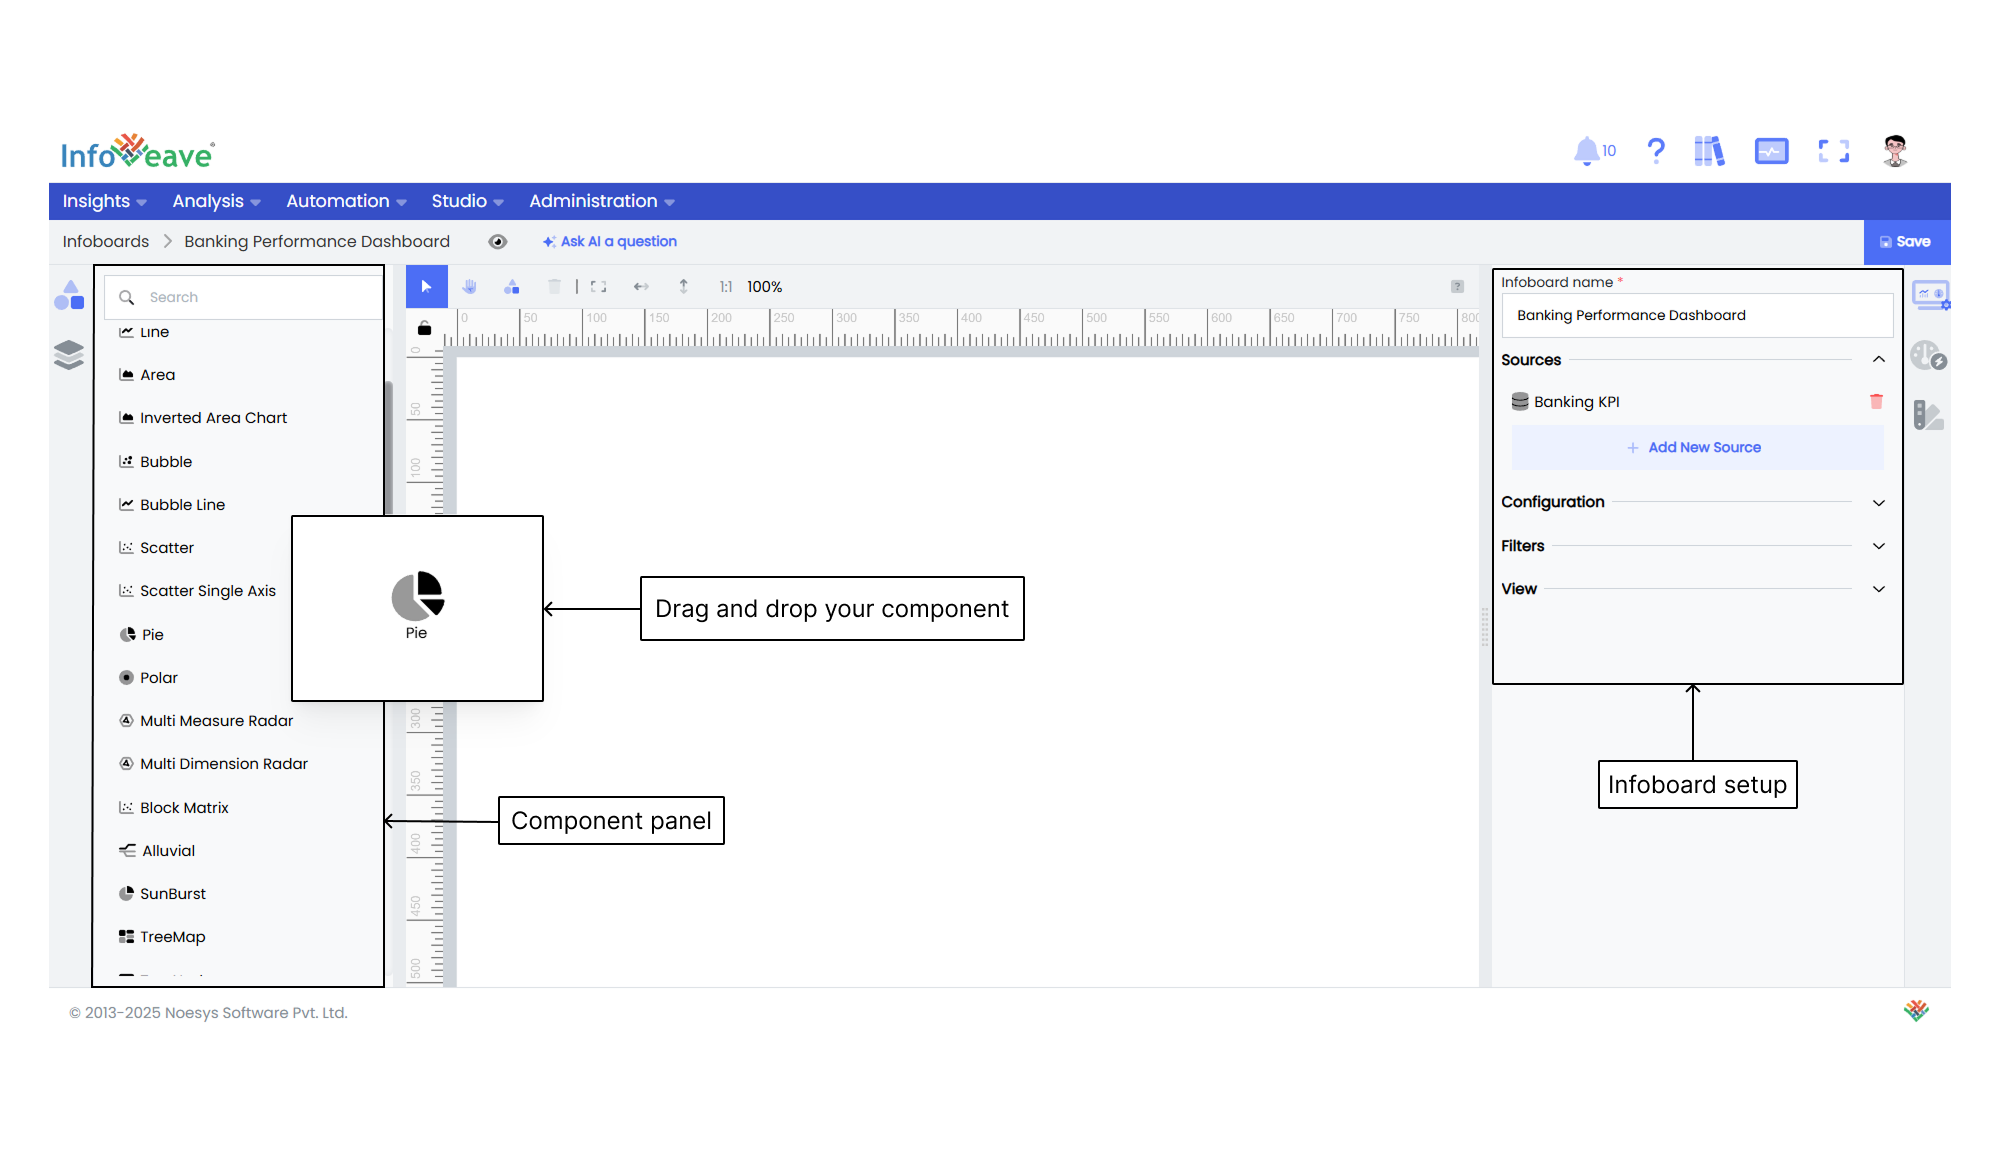
   ![Drag & Drop Widget.](/images/Insights/Infoboards/Creating-Infoboard/setupinfoboard.png)  

</Steps>

<Aside>

When you create a new Infoboard, the **Infoboard Source** screen appears automatically. For more details, visit [Linking a Datasource with an Infoboard](/insights-v8/create-infoboard/#linking-a-datasource-with-an-infoboard).  
![Data source screen](/images/Insights/Infoboards/Creating-Infoboard/datasource-screen-bydefault.png)

</Aside>

### Infoboard Setup

<Steps>

8. Configure your Infoboard under the **Infoboard Setup** tab.  
9. Select the appropriate date range to define the data’s time frame. You can choose from  
   - **Default** uses the dataset’s default date range.  
   - **Fixed dates** lets you specify ranges by Year, Quarter, Month, Week, or Day.  
   - **No dates** disables date-based filtering if not required.  
   For more details, visit [Using the date range filter](/insights-v8/create-infoboard/viewing-infoboard/#using-the-date-range-filter).  
10. Use the dropdown to select workflows and jobs to associate with your Infoboard.  

</Steps>


<Aside>

- Saved templates appear under **Insights** <i class="fa-duotone fa-regular fa-arrow-right"></i> **My Workspace** <i class="fa-duotone fa-regular fa-arrow-right"></i> **Created by Me**.  
- For details on configuring Infoboard Sources, visit the [Infoboard Setup](/insights-v8/guide-to-infoboard-designer/customize-panel/setup) section.  
- To explore customization options, visit [Widget Customization](/insights-v8/guide-to-infoboard-designer/customize-panel/customization-tab).  
- For advanced settings, refer to [Advanced Configuration](/insights-v8/advanced-configuration).  

</Aside>


### Linking a Datasource with an Infoboard

Linking data lets you configure the appropriate source for your Infoboard storytelling. You can connect your Infoboard to five types of sources datasource, query, raw data, API, and code.

Let’s go through the steps to select the source type.

![Add Source](/images/Insights/Infoboards/Creating-Infoboard/Add-Source.png)

<Steps>

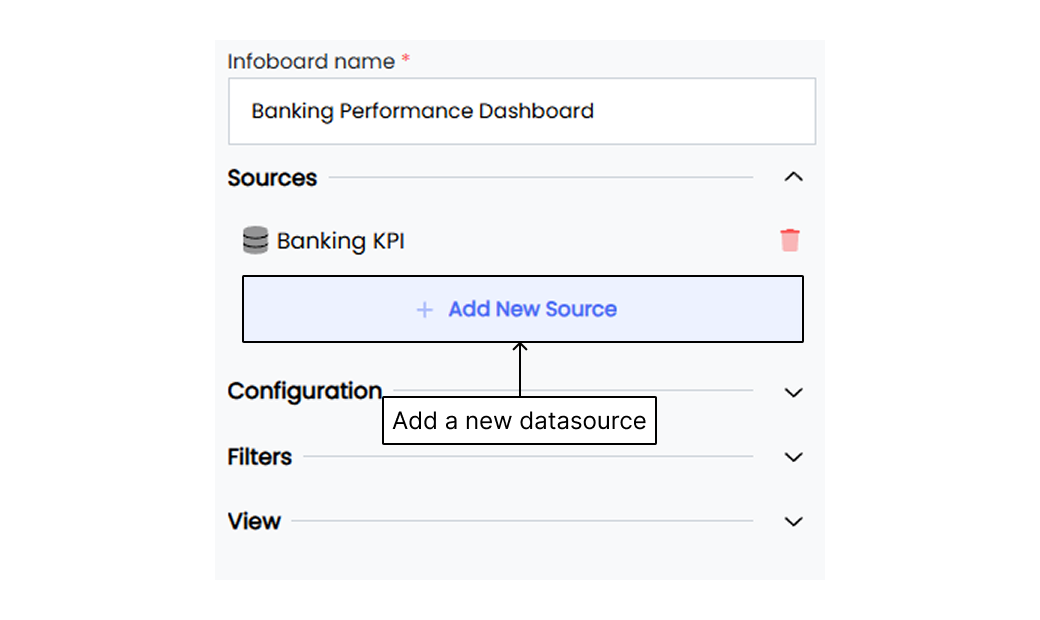
1. Click **Add New Source** under **Sources** to begin selecting a source for your widgets.  
2. Choose from these five options  
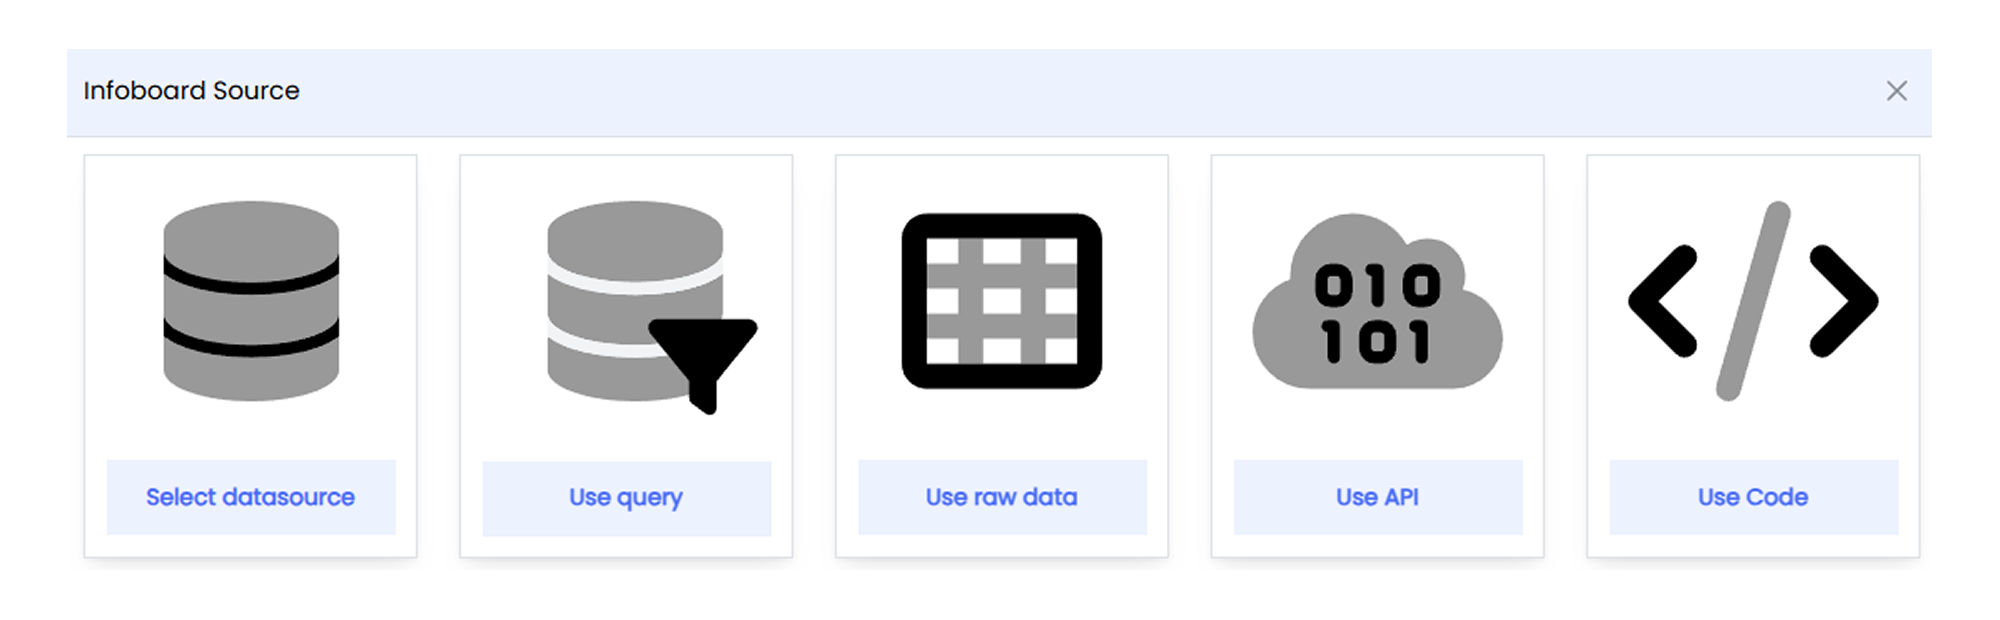
   ![Data Source Types](/images/Insights/Infoboards/Creating-Infoboard/Data-Source-Types.png)  
   - **Select datasource**  
     Choose from existing datasources with relevant data.  
     Learn more [Infoveave Datasource](/insights-v8/guide-to-infoboard-designer/customize-panel/setup#datasource)  
   - **Use query**  
     Click **Use query** to write a custom SQL query.  
     Learn more [Query Datasource](/insights-v8/guide-to-infoboard-designer/customize-panel/setup#query-datasource)  
   - **Use raw data**  
     Click **Use Data** to upload raw data from an Excel file.  
     Learn more [Raw Datasource](/insights-v8/guide-to-infoboard-designer/customize-panel/setup#raw-datasource)  
   - **Use API**  
     Click **Use API** to fetch data using an API.  
     Learn more [API Datasource](/insights-v8/guide-to-infoboard-designer/customize-panel/setup#api-datasource)  
   - **Use Code**  
     Click **Use Code** to generate data programmatically.  
     Learn more [Code source](/insights-v8/guide-to-infoboard-designer/customize-panel/setup#code-source)  

</Steps>

### Adding Widgets 
![Configure](/images/Insights/Infoboards/Creating-Infoboard/Configure.png)

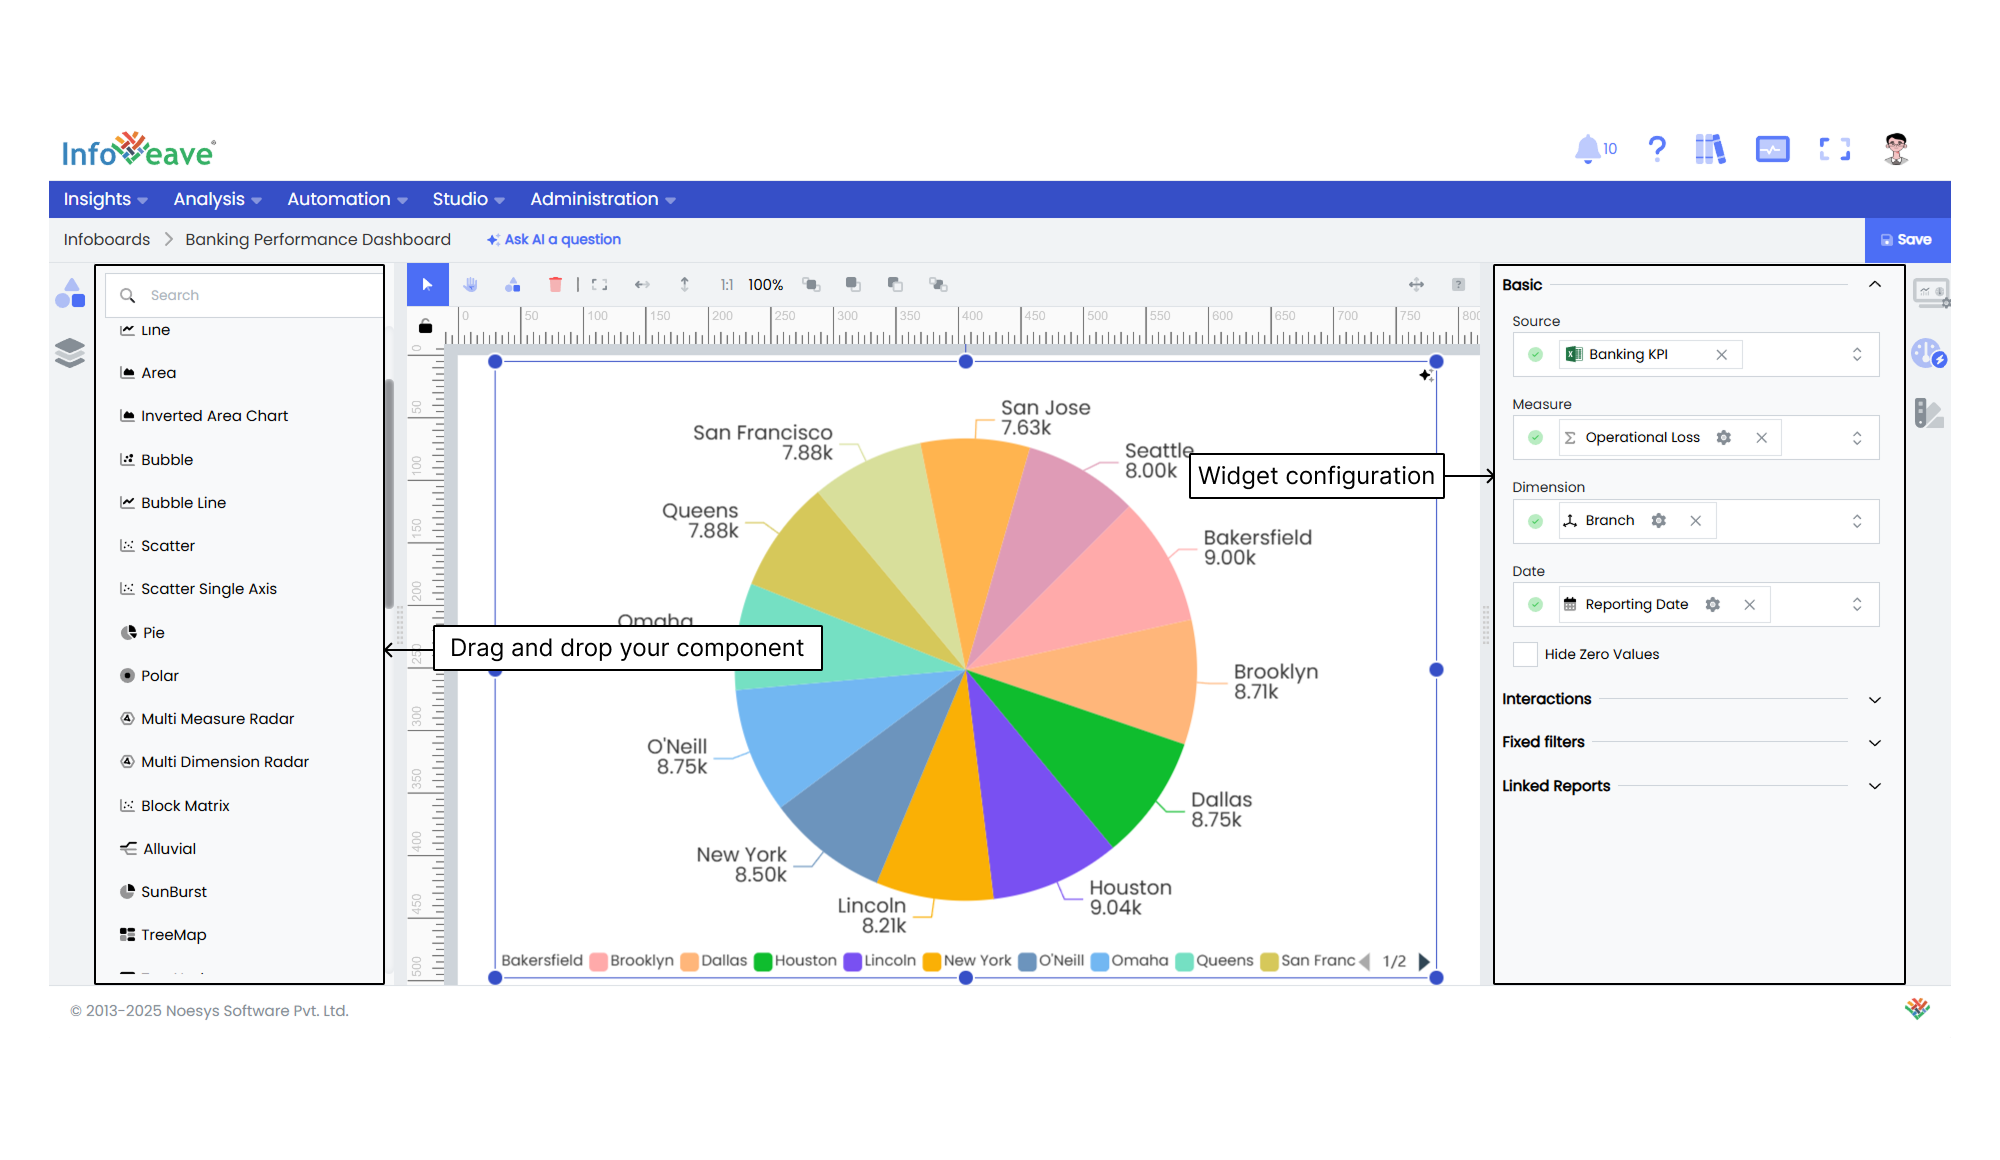
Add widgets to your Infoboard using the drag-and-drop feature. Choose the appropriate data source and define the required measures and dimensions.

<Steps>

1. Drag and drop the widget from the component panel to the **Infoboard Designer**.  
2. You can also double-click the widget to add it.  

</Steps>

### Configuring Widgets
<Steps>

3. Click the widget you want to configure.  
4. Open the **Widget Configuration** tab and set the datasource, measures, and dimensions.  

</Steps>

<Aside>

Widget configuration varies by type. Common fields include  
- **Datasources** Select the data source.  
- **Value** Define the measure to display.  
- **Axis** Configure the axis (e.g., X-axis, Y-axis).  
- **Group** Set grouping options.  
- **Date** Define time-based parameters.  
- **Other fields** Vary depending on widget (e.g., size, dimensions, rows, columns).  

</Aside>

### Formatting the Measure
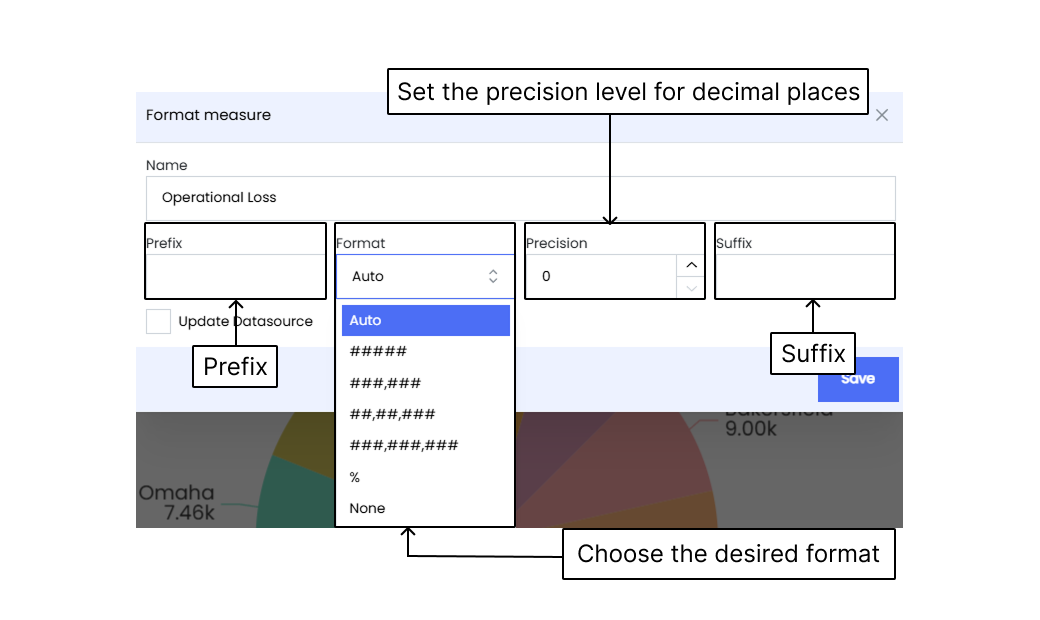
![Format Measure](/images/Insights/Infoboards/Creating-Infoboard/Configure-Measure.png)
<Steps>

1. Click the gear icon <i class="fa-duotone fa-regular fa-gear"></i> next to the measure.  
2. Rename the measure.  
3. Specify the unit or quantity.  
4. Add a prefix if needed.  
5. Choose the format **Auto, %,** or **None.**  
6. Set decimal precision.  
7. Add a suffix if required.  

</Steps>

### Formatting the Dimension
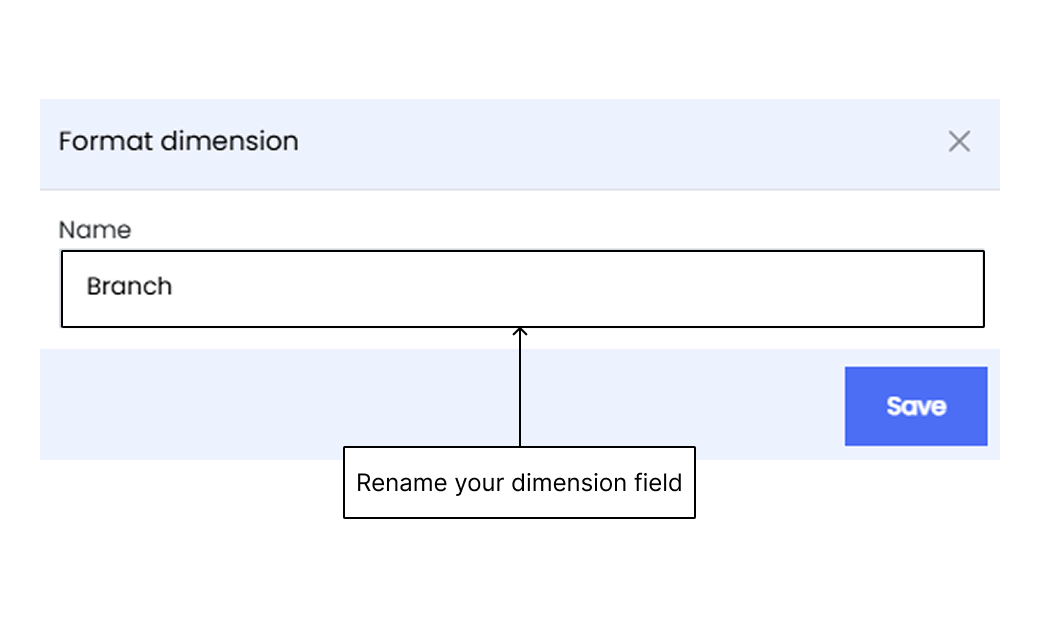
![Format Dimension](/images/Insights/Infoboards/Creating-Infoboard/Format-Dimension.png)
Click the gear icon <i class="fa-duotone fa-regular fa-gear"></i> next to the dimension to rename it.


### Formatting the Date Dimension
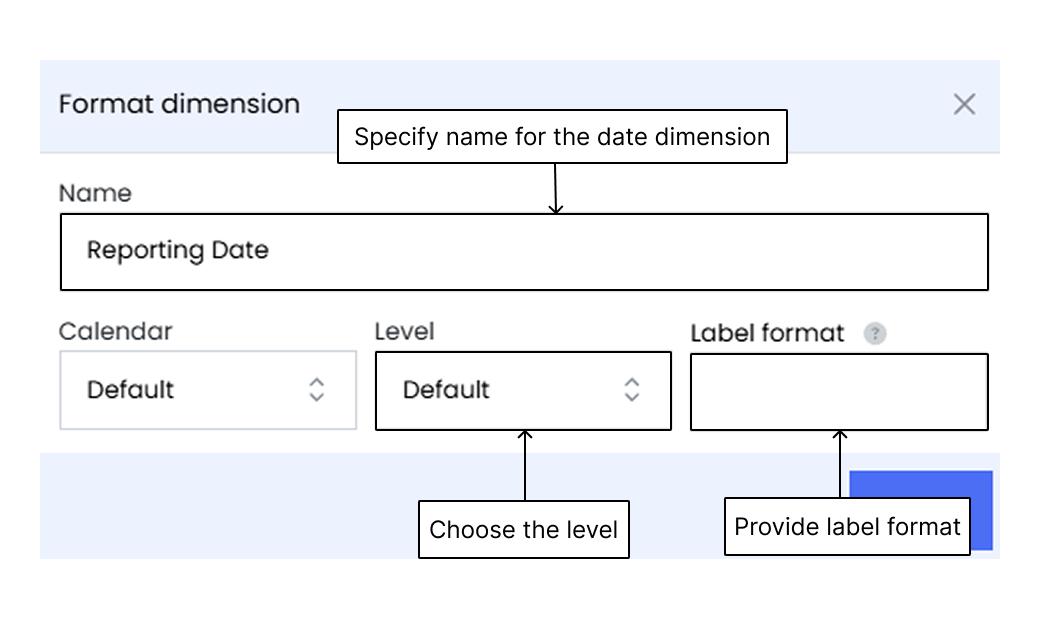
![Format Date Dimension](/images/Insights/Infoboards/Creating-Infoboard/Format-Date-Dimension.png)
<Steps>

1. Click the gear icon <i class="fa-duotone fa-regular fa-gear"></i> next to the date dimension.  
2. Provide a name for the date dimension.  
3. Choose the order date.  
4. Select the calendar type **Default, FY Calendar,** or **Custom Calendar.**  
5. Set granularity **Default, Year, Quarter, Month, Week,** or **Day.**  
6. Define the label format.  

</Steps>

### Adding Drill Down Filters

<MediaPlayerComponent video="Configure-Drill-Down.mp4"
chapters={[
  {
    "start": 0,
    "end": 1,
    "text": "Open Infoboard in Designer View",
    "description": "The video starts showing the 'Bank Transaction Analysis' Infoboard open in designer view, ready for modifications."
  },
  {
    "start": 1,
    "end": 5,
    "text": "Adjust Infoboard Height",
    "description": "Click the 'Fill Height' button to expand the Infoboard and display all its contents within the available screen space."
  },
  {
    "start": 5,
    "end": 7,
    "text": "Open Chart Configuration Panel",
    "description": "Click the 'Configuration' icon on the right-side panel to open the settings for the currently selected chart, 'Average Transaction Amount by Region'."
  },
  {
    "start": 7,
    "end": 12,
    "text": "Enable Drill and Apply Filters Interaction",
    "description": "In the chart configuration panel, scroll down to the 'Interactions' section, and then select the 'Drill and apply filters' radio button to enable drill-down functionality."
  },
  {
    "start": 12,
    "end": 13,
    "text": "Add a New Drill Level",
    "description": "Click the '+ Add drill level' button to add a new level for drilling down into the data."
  },
  {
    "start": 13,
    "end": 19,
    "text": "Configure Drill Level Axis to Age Bucket",
    "description": "In the newly added Drill Level 2 section, click the Axis dropdown. Type age_bucket and then select it from the suggested fields."
  },
  {
    "start": 19,
    "end": 23,
    "text": "Save Infoboard Changes",
    "description": "Click the 'Save' button in the top right corner of the screen to finalize the new user creation. A success message confirms the save."
  },
  {
    "start": 23,
    "end": 29,
    "text": "Fit Infoboard to Screen",
    "description": "After the Infoboard reloads in view mode, click the 'Fit Board' icon in the top right toolbar to ensure the entire dashboard is visible on the screen."
  },
  {
    "start": 29,
    "end": 33,
    "text": "Perform Drill-Down on Chart",
    "description": "Click on the 'Northeast' bar within the 'Average Transaction Amount by Region' chart. This action drills down to display the transaction amounts by 'age_bucket' specifically for the Northeast region."
  },
  {
    "start": 33,
    "end": 41,
    "text": "Reset Drill-Down View",
    "description": "Click the 'Reset Drill' icon near the top of the Infoboard to revert the chart to its original, aggregated view, removing the applied drill-down filter."
  }
]}
poster="/images/introduction-poster.png"
posterText="Configuring Drill Down"
client:load/>

![Drill Downs](/images/Insights/Infoboards/Creating-Infoboard/Drill-Downs.png)
<Steps>
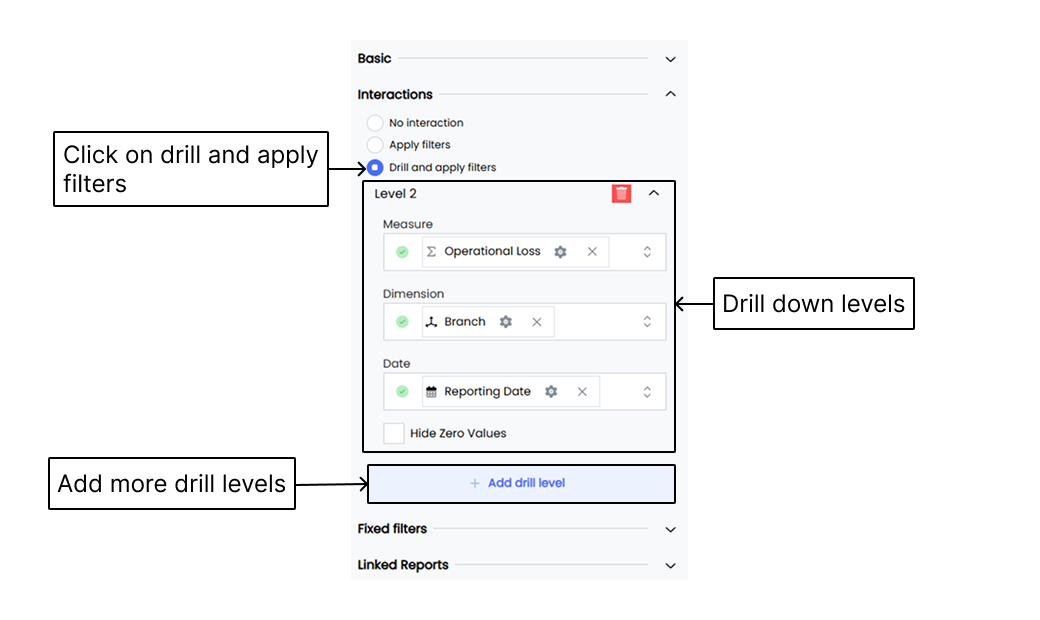
1. Click **Interactions** in the widget configuration tab.  
2. Choose **Drill and apply filters**.  
3. Click **+ Add drill level** to create a new level. You can add up to 2 levels.  
4. Use different measures and dimensions for each level.  
5. Click **Save** to apply. 
6. To delete drill level click on delete <i class="fa-duotone fa-regular fa-trash" style="--fa-primary-color: #ec4141; --fa-secondary-color: #ec4141;"></i> icon.
</Steps>


<Aside>
- Drill down is widget-specific.  
- You cannot change the datasource for drill-down levels.  
- Use the **Drill out** button to go back.  
</Aside>

### Adding Fixed Filters
![Fixed Filters](/images/Insights/Infoboards/Creating-Infoboard/Fixed-Filters.png)
<Steps>

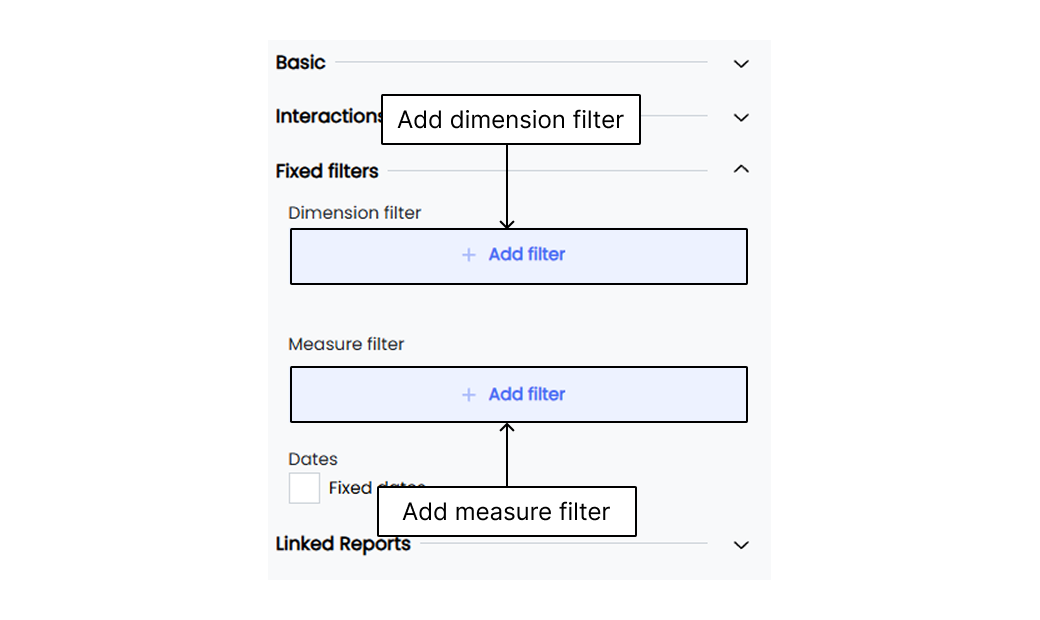
1. Click **Fixed filters** under the **Widget Configuration** tab.  
2. Click **Add filter** to define dimension and measure filters.  

</Steps>

### Configuring a Dimension Filter
<Steps>

1. Select the dimension.  
2. Choose a condition (e.g., "are," "are not," "in," "not in").  
3. Enter the filter value.  

</Steps>

### Configuring a Measure Filter
<Steps>

1. Choose the measure.  
2. Pick a comparison condition (e.g., "greater than," "less than").  
3. If using a fixed value  
   - Enter the value.  
4. If comparing measures  
   - Select the second measure.  
5. To add more filters, repeat the steps. Use AND/OR to combine them.  
6. Save or apply the changes.  

</Steps>

<Aside>

To learn more about widget data sources, visit [Widget Configuration](/insights-v8/guide-to-infoboard-designer/customize-panel/configure/).  

</Aside>

### Customizing Widgets

Widget customization in Infoveave lets you adjust the visual style of widgets to match your data storytelling needs.


![Customize Widgets](/images/Insights/Infoboards/Creating-Infoboard/Customize-Widgets.png)
<Steps>

1. Select the widget on the designer canvas.  
2. Explore customization options  
   - **Styling** Adjust colors, fonts, borders, and backgrounds.  
   - **Labeling** Edit labels and captions.  
   - **Interactivity** Enable or disable tooltips and click actions.  
3. To edit labels like Axis Name or Value, click the **Label** button.  
4. Customization features include  
   - **Font Size** Adjust visibility and readability.  
   - **Font Style** Match your visual theme.  
   - **Alignment** Set left, center, or right alignment.  
5. Click **Save** to apply the changes.  
6. Click the view icon <i class="fa-duotone fa-regular fa-eye"></i> to preview your Infoboard.  

</Steps>

<Aside type="tip">

To rename axes, series, or values, delete the default name and enter your own.  

</Aside>

<Aside>

Widget-specific settings may vary. Each widget may offer different parameters for customization.  

</Aside>
 
## Creating an Infoboard Using AI

<Aside>The AI-generated Infoboard follows a grid-based layout.</Aside>

This feature allows you to create your Infoboard automatically using GenAI with minimal input such as the input Datasource. GenAI generates visualisations based on the data you provide.

Enable the **AI enabled** toggle to start using AI for creating an Infoboard.

![select datasource](/images/Insights/Infoboards/Creating-Infoboard/create-infoboard-using-AI.png)


### Choosing How to Generate an Infoboard

GenAI analyses the input data and provides a detailed summary. You have the option to generate an Infoboard automatically or specify your own analysis parameters.


![choose dataset](/images/Insights/Infoboards/Creating-Infoboard/fovea-datasource.png)

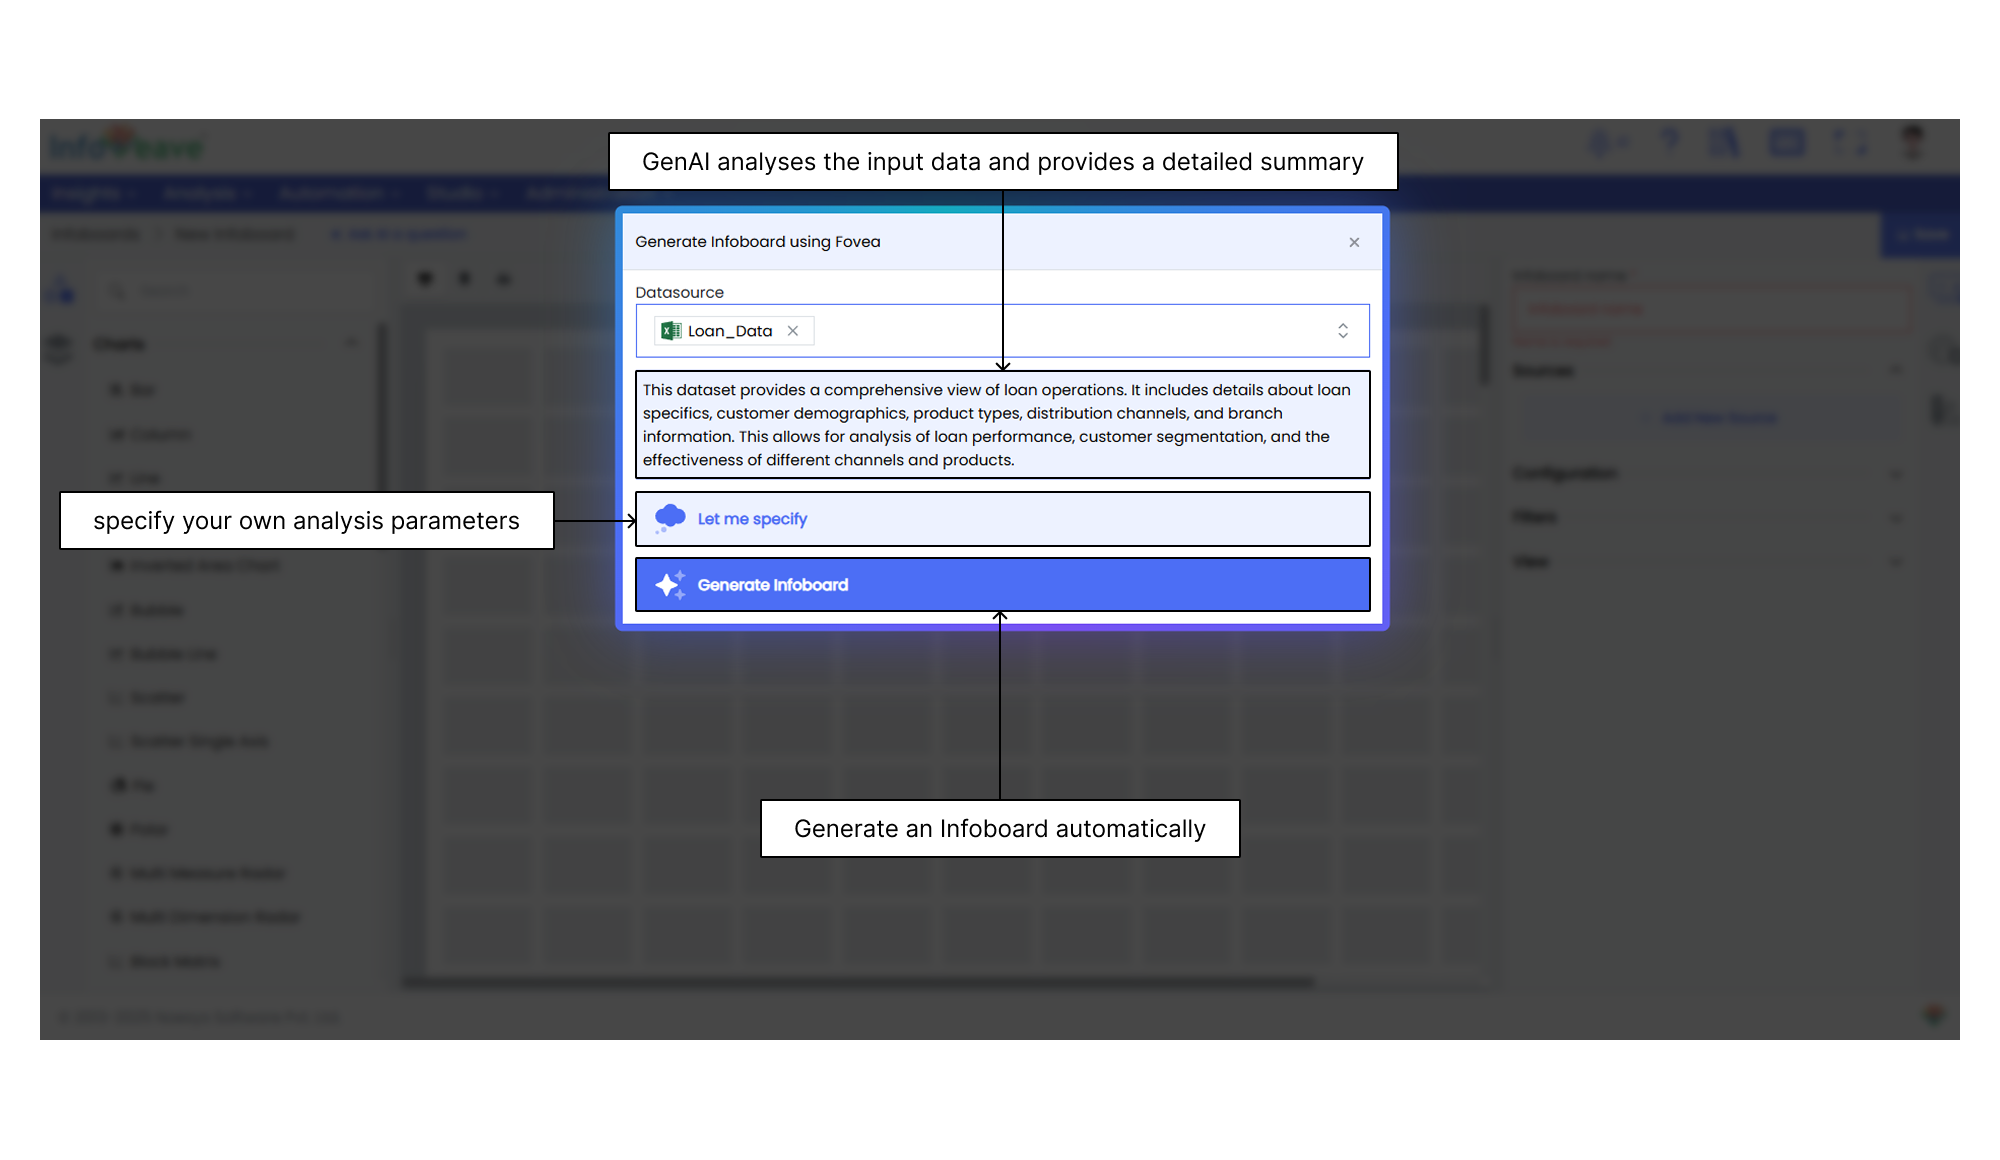
### Generating an Infoboard Automatically
![choose dataset](/images/Insights/Infoboards/Creating-Infoboard/Aigeneratedinfoboard.png)


**Choose the option Generate Infoboard.**

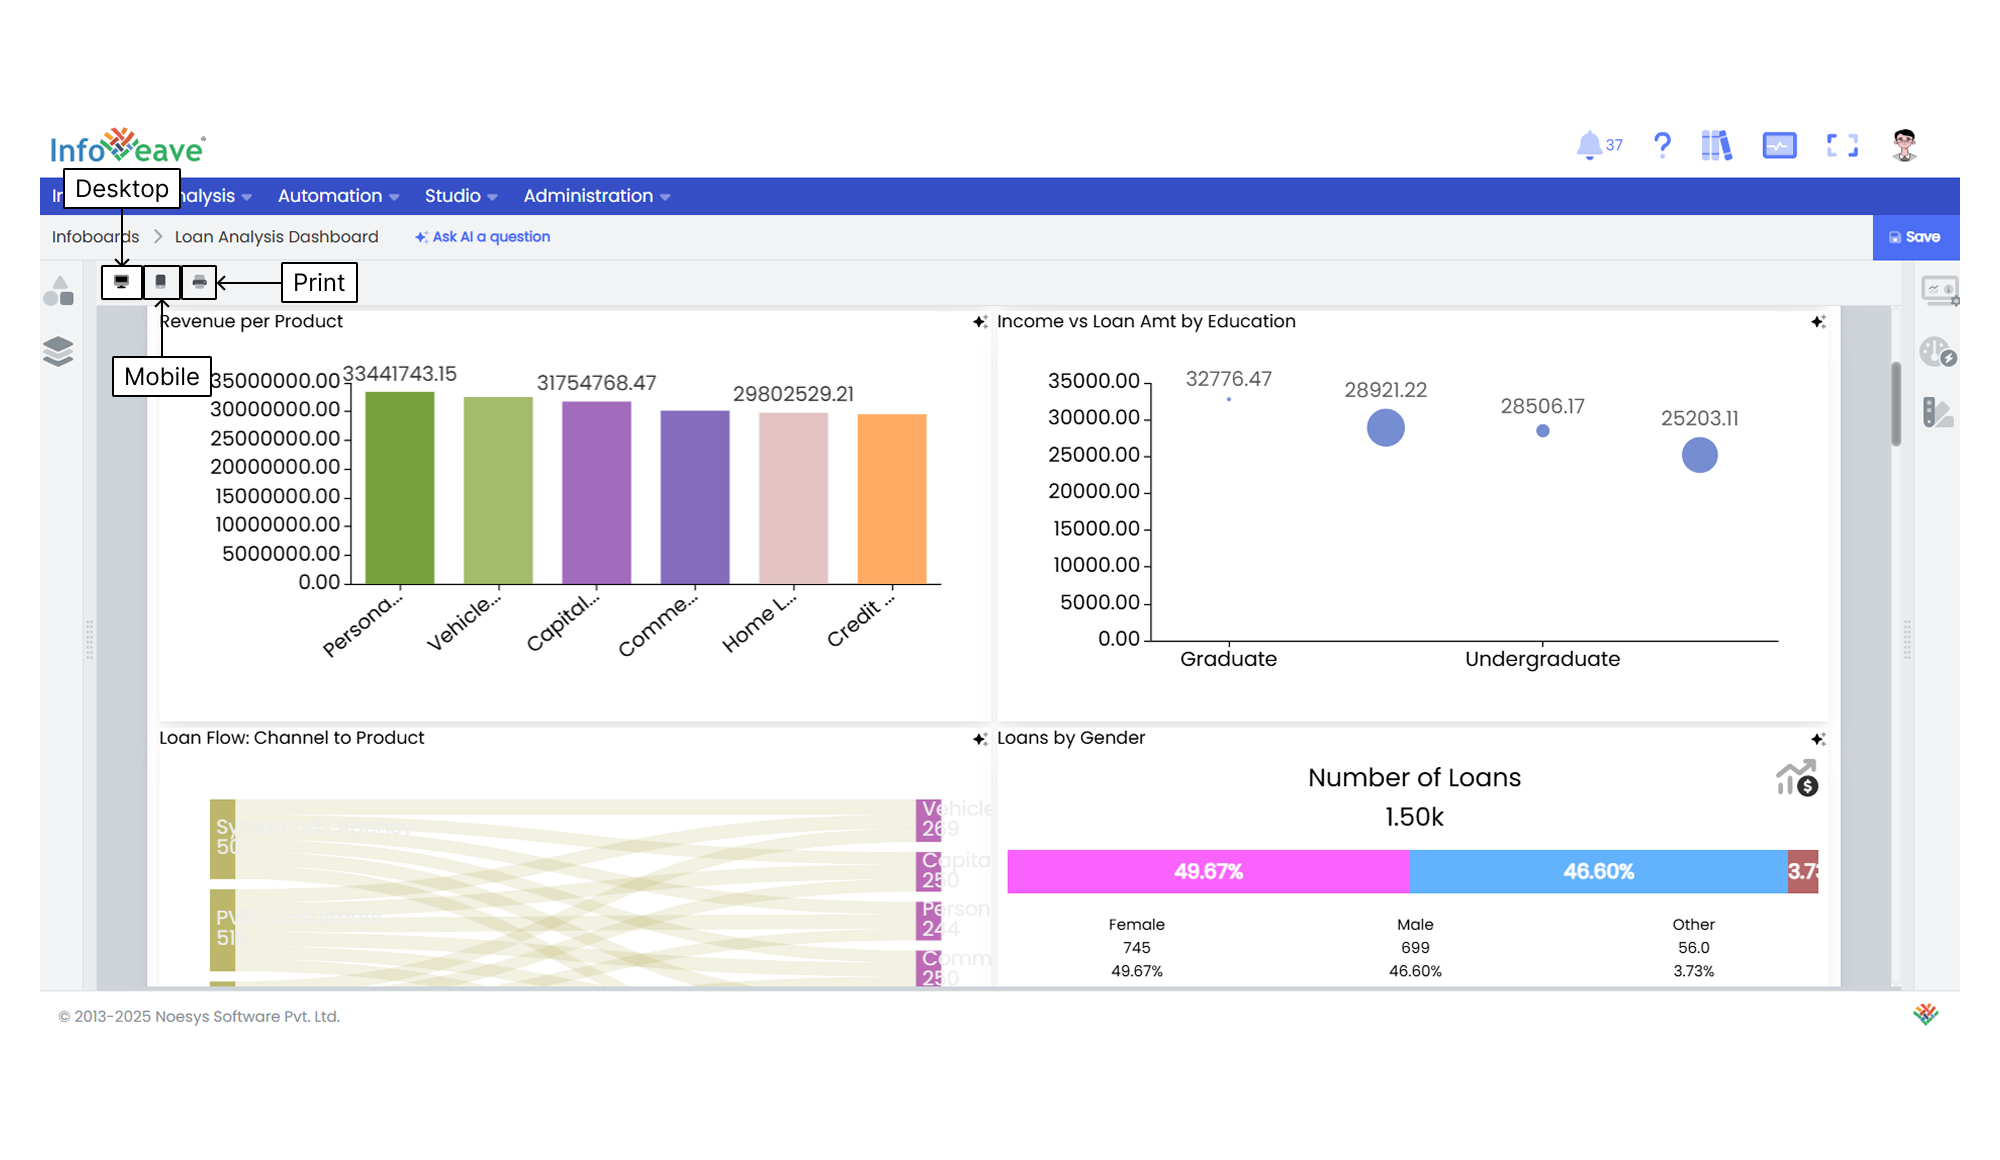
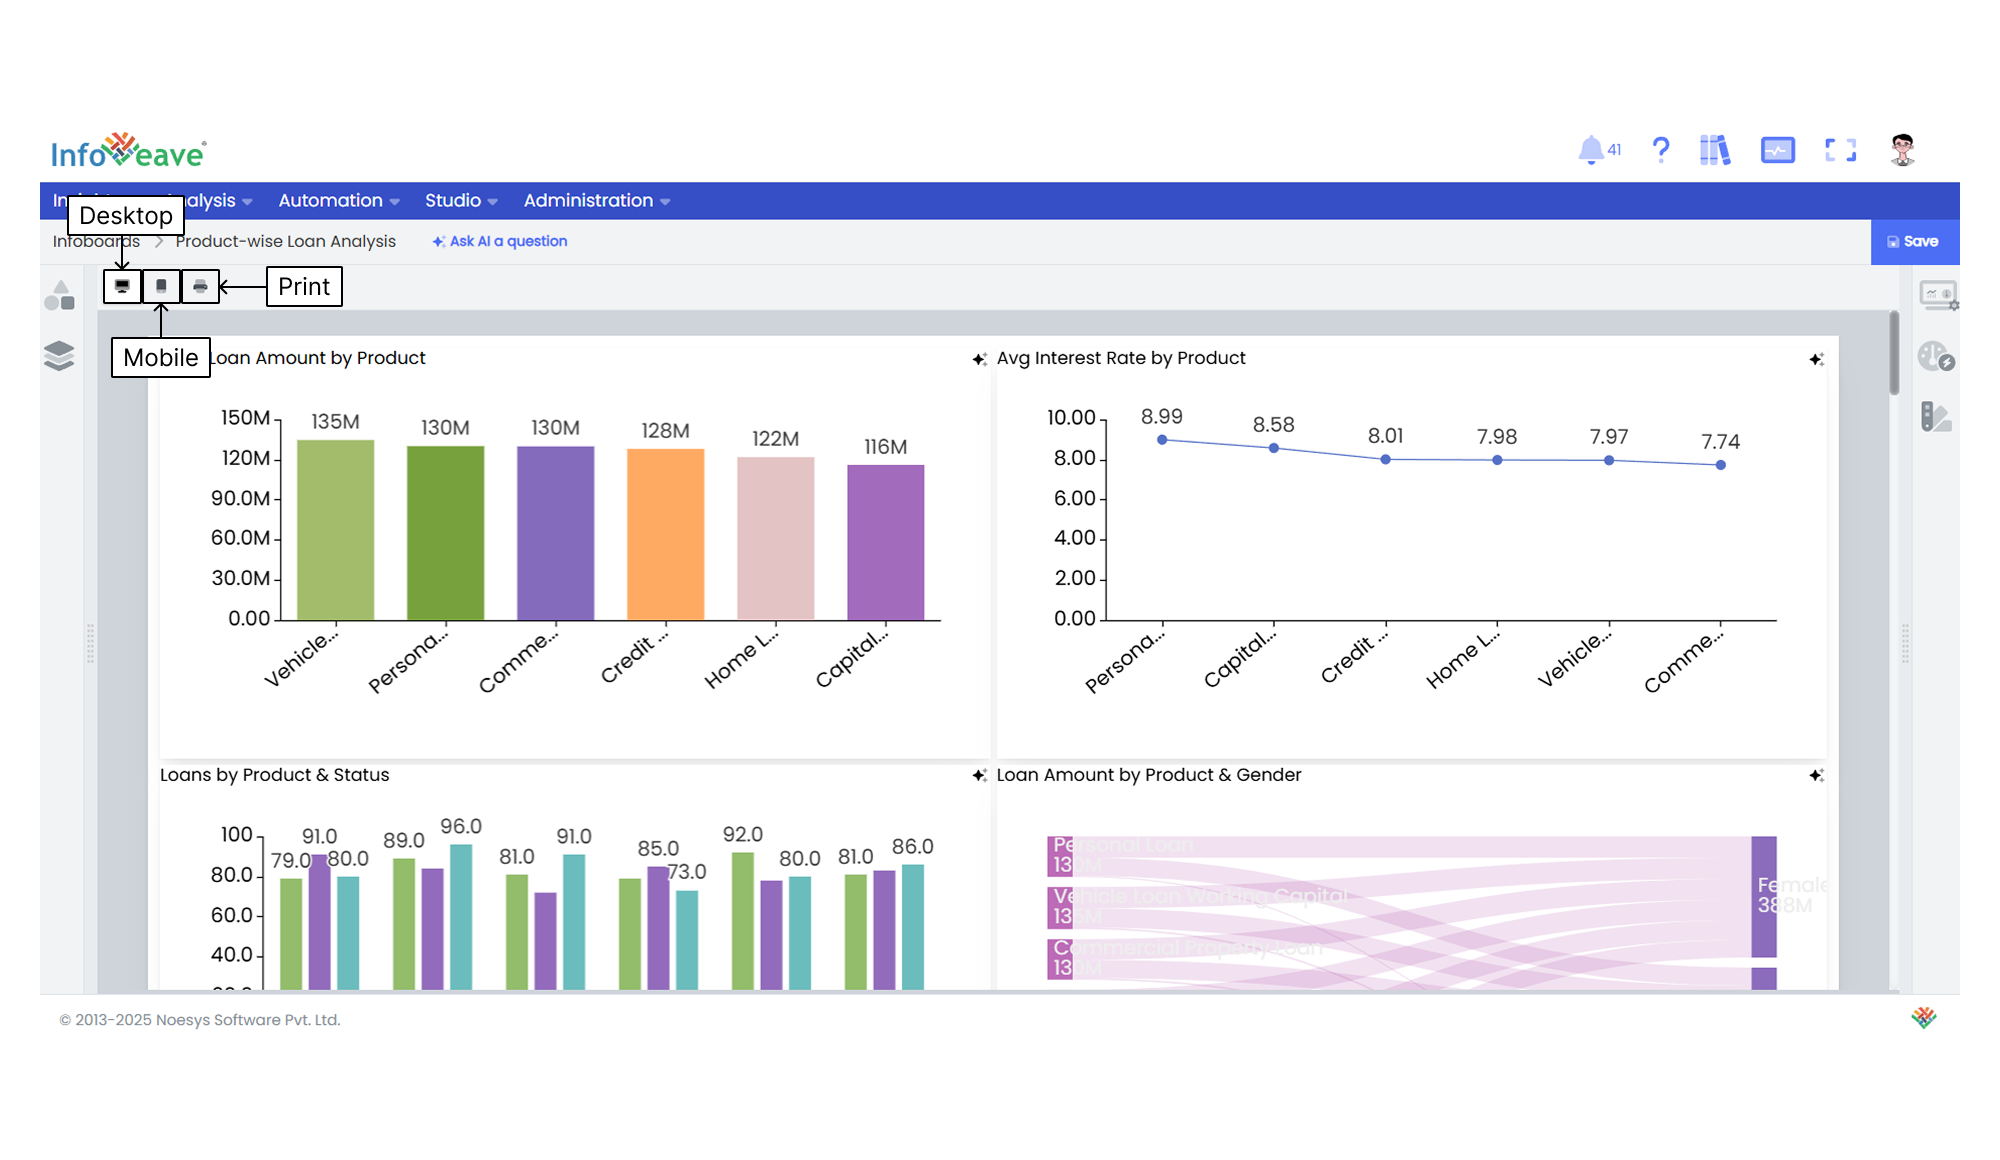
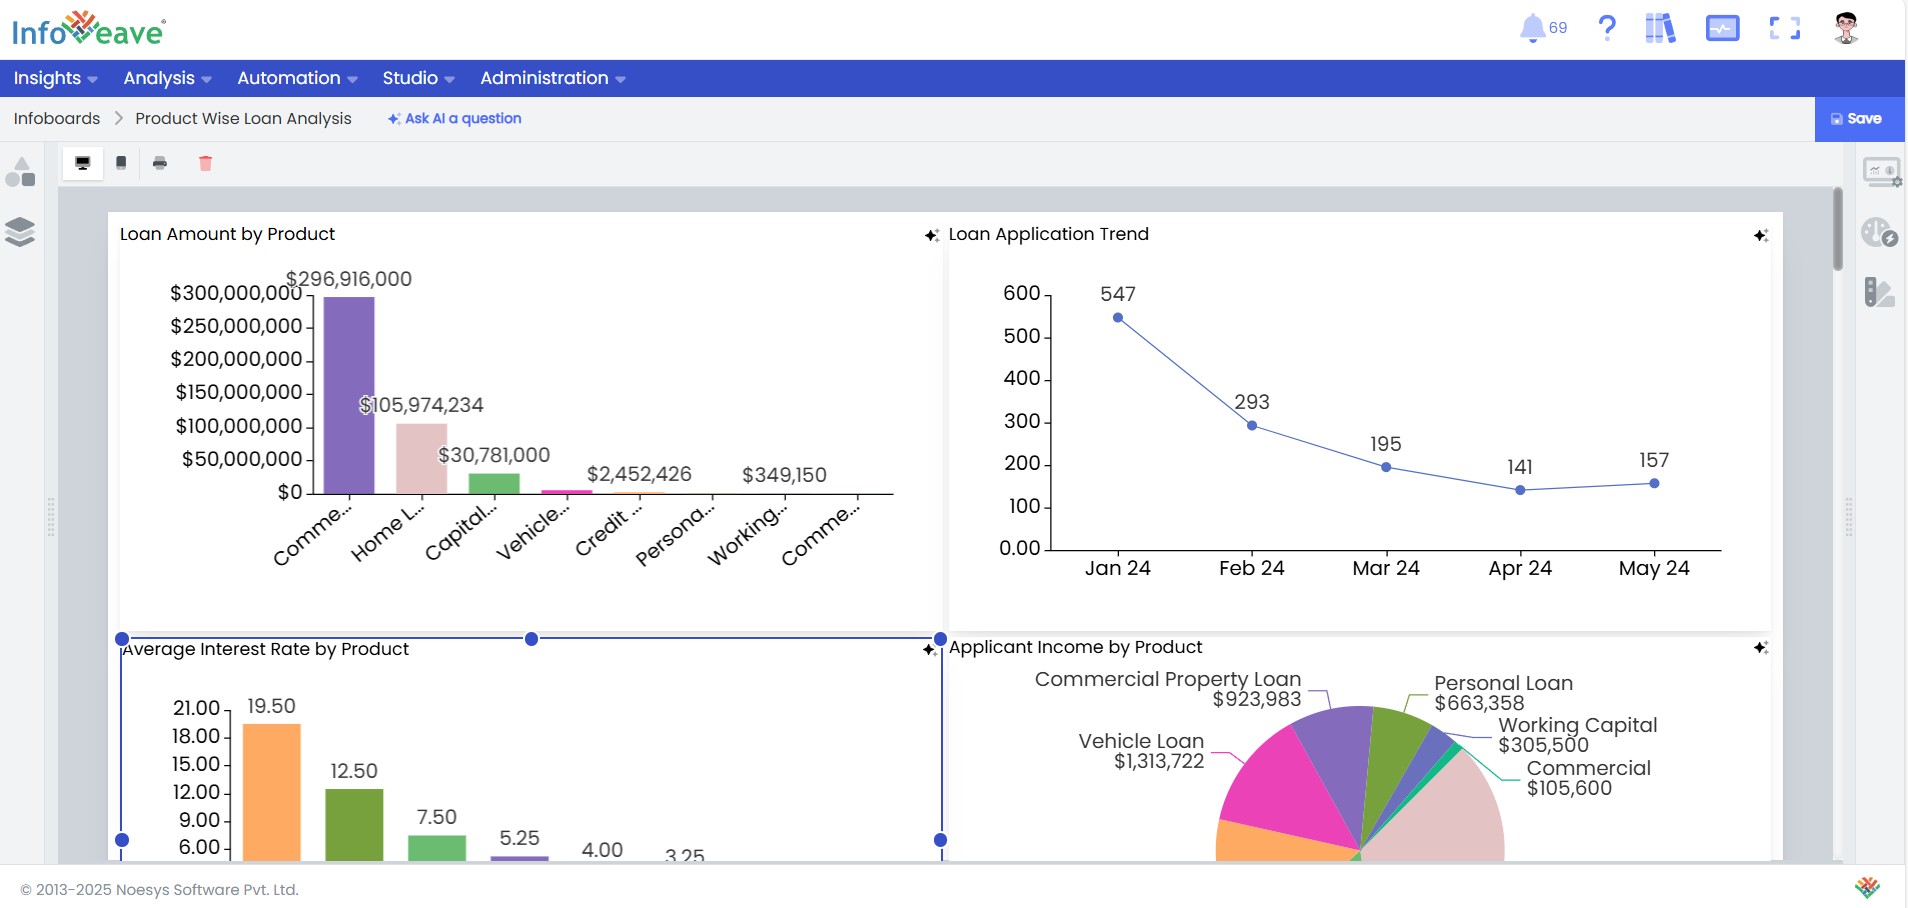
* Generate Infoboard does not require any further input. It creates visualisations based on its analysis of the data for three default layouts – Desktop, Mobile and Print.  
* You can delete any unwanted visualisations by selecting the relevant chart and clicking on Delete.  
* You can review the visualisations and ask AI to generate more charts if required. Click on the option **Ask AI** to do this.

### Specifying Parameters by Choosing "Let Me Specify"


![let me specify](/images/Insights/Infoboards/Creating-Infoboard/genaiprompt.png)
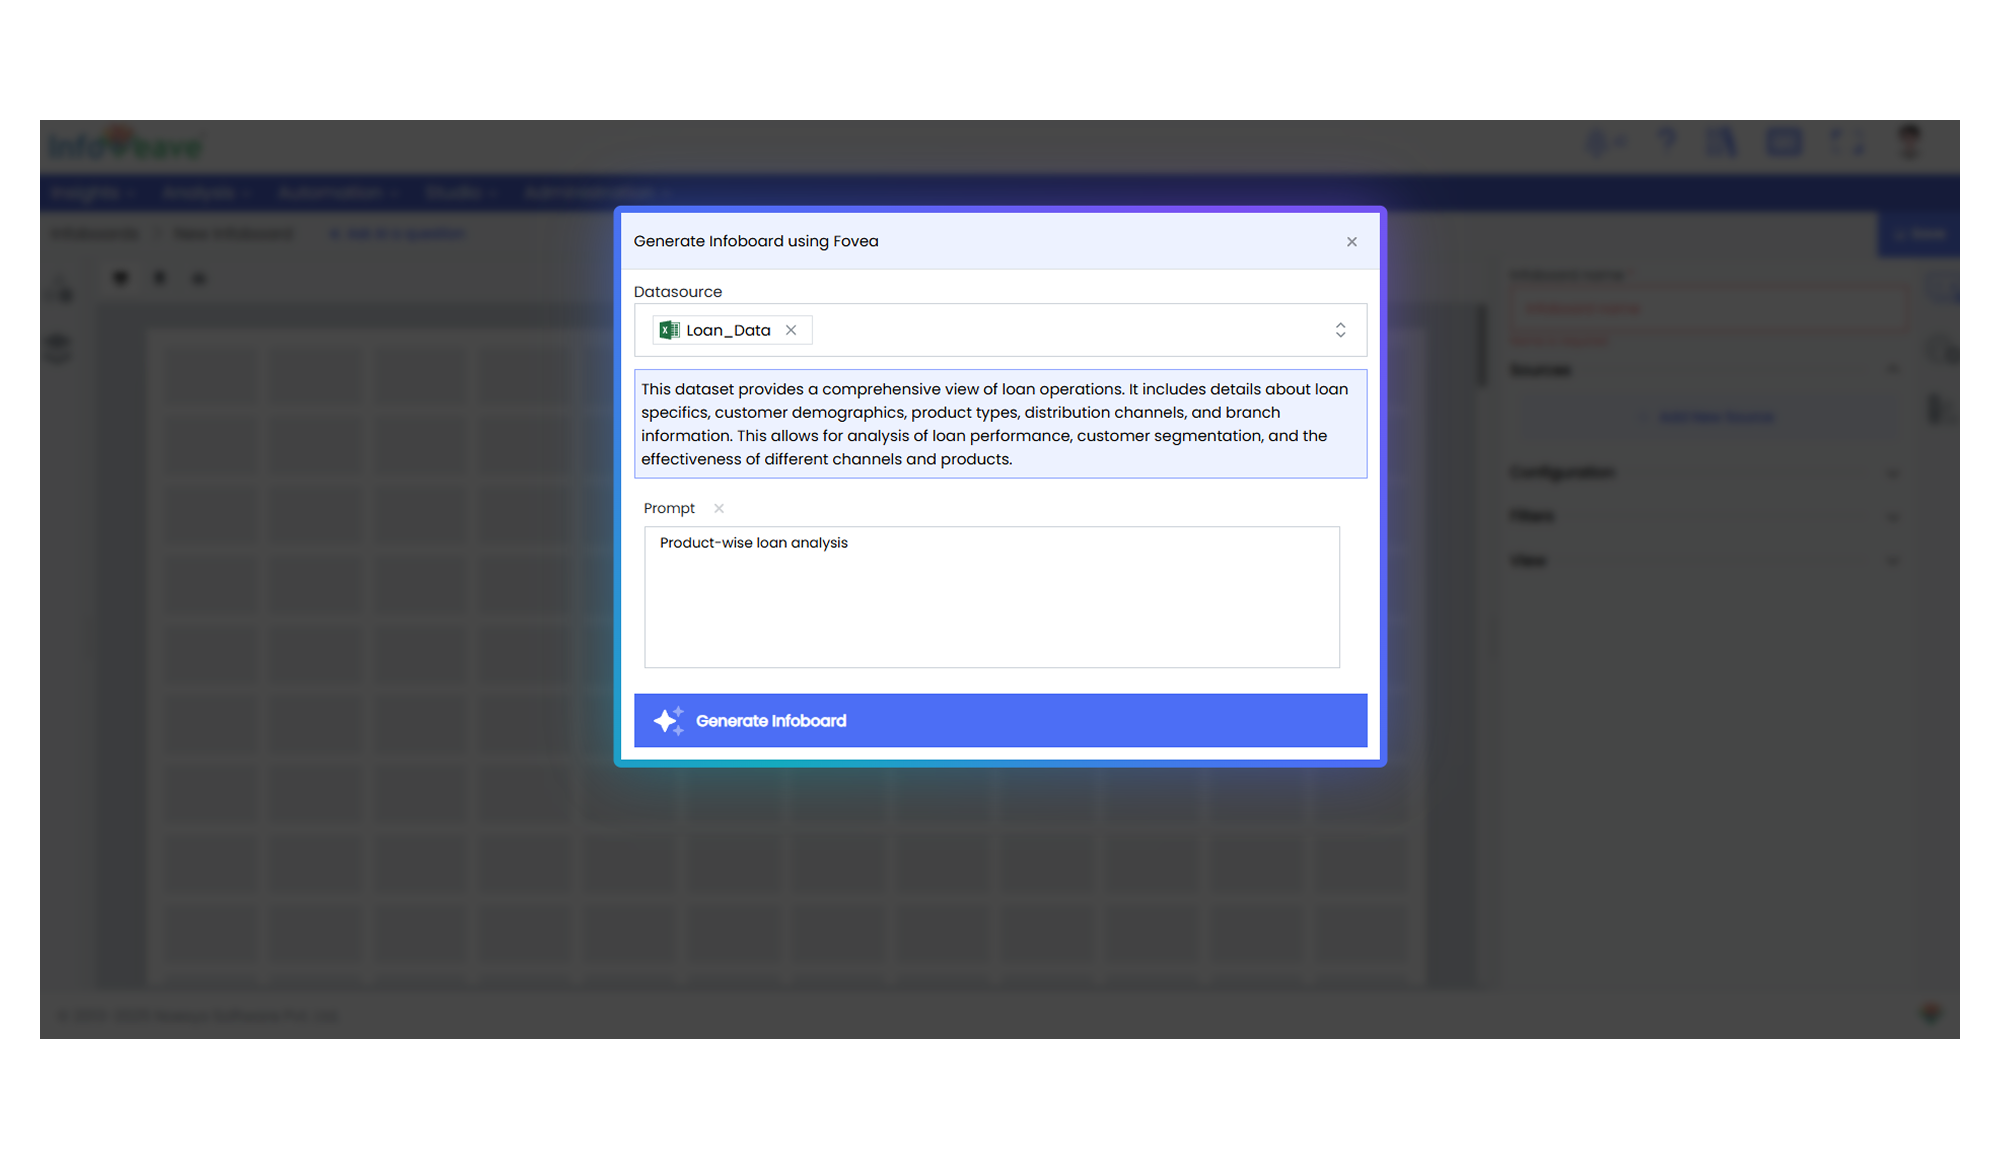
**Choose Let Me Specify.**

Enter the required parameters for analysis and click on **Generate Infoboard**.

![choose dataset](/images/Insights/Infoboards/Creating-Infoboard/loananalysis.png)
* GenAI automatically creates visualisations based on the analysis parameters for three default layouts – Desktop, Mobile and Print.  
* You can delete any unwanted visualisations by selecting the relevant chart and clicking on Delete.

![specify parameters](/images/Insights/Infoboards/Creating-Infoboard/loanai.png)
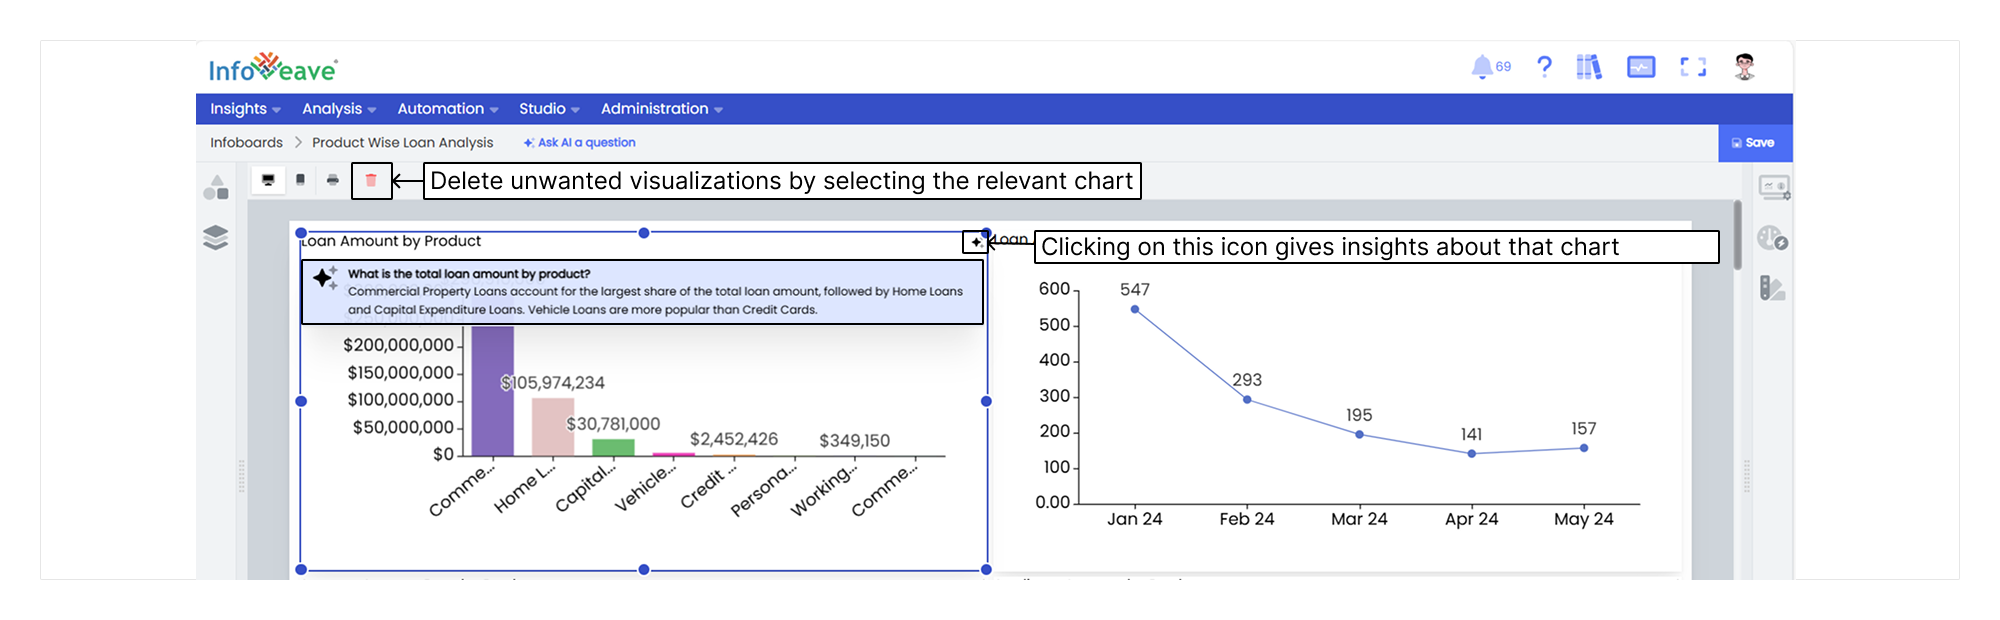
AI generates detailed insights for each visualisation. You can view these insights by clicking on the icon next to the chart title.

You can review the visualisations and ask AI to generate additional charts if needed. Click on the option **Ask AI** to proceed.

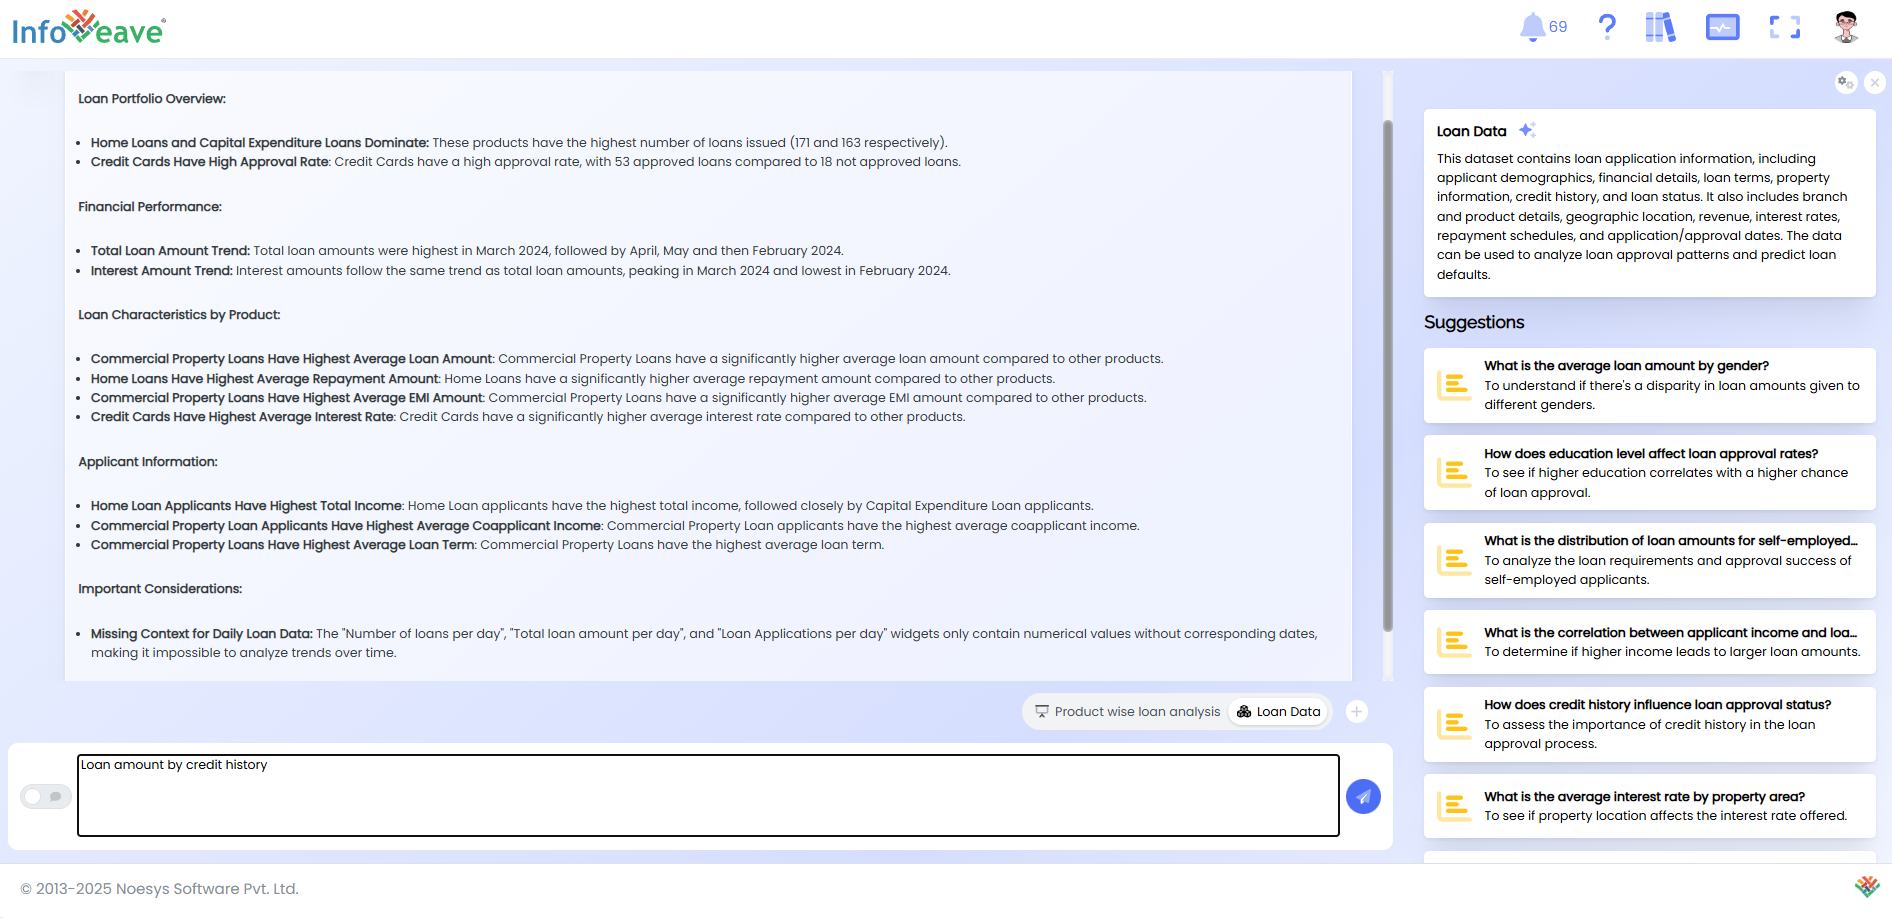
### Asking AI a Question

![ask ai](/images/Insights/Infoboards/Creating-Infoboard/ask-ai.png)
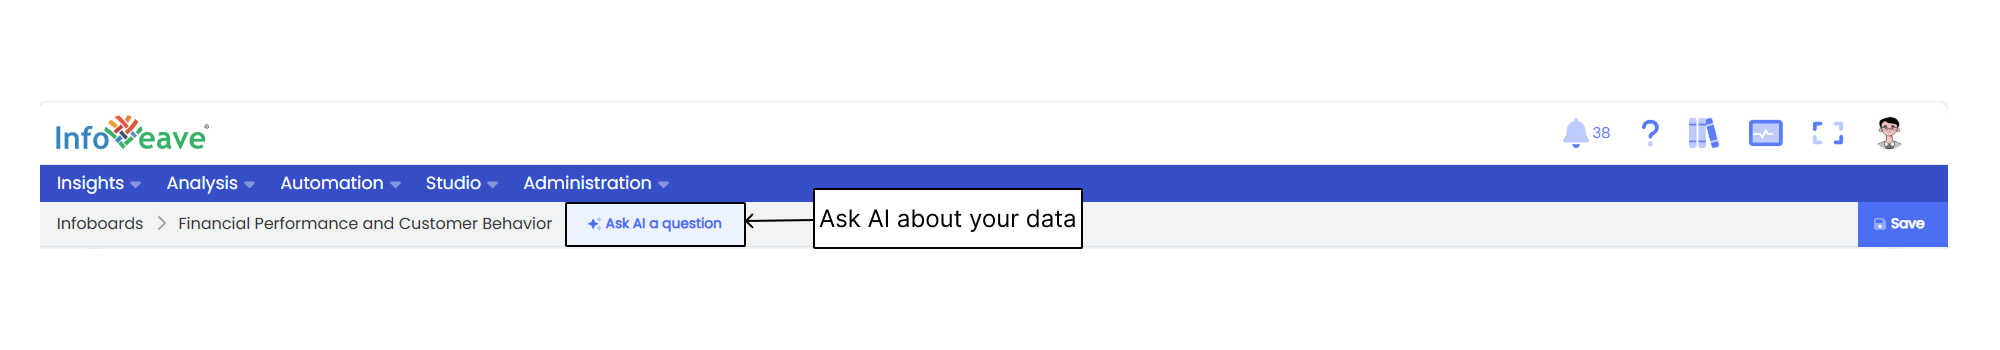
This feature allows you to ask a question to AI in both AI-generated and custom-created Infoboards.

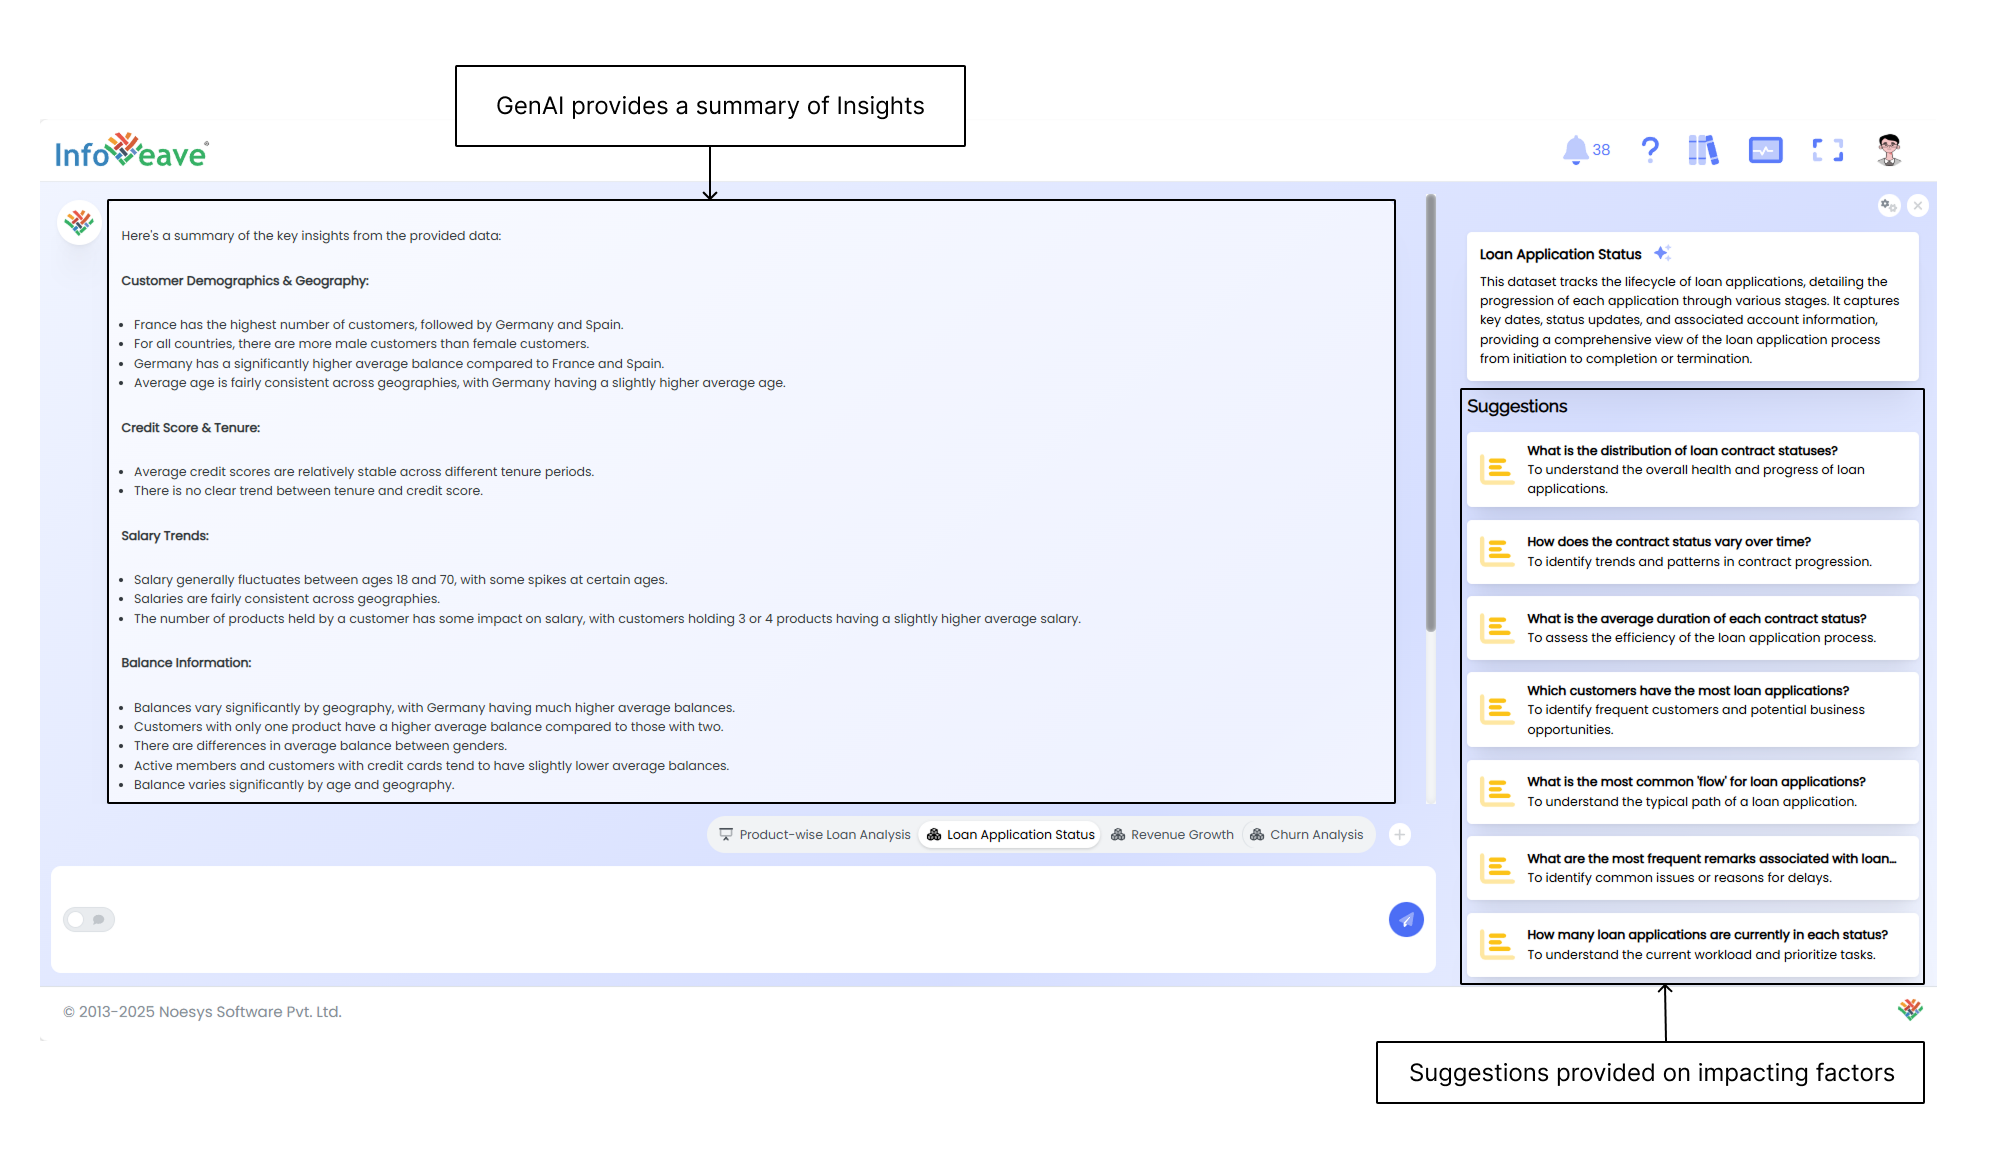
When you click on this option, GenAI provides a summary of insights, data and suggestions about key factors that impact your KPIs.

![ask ai screen](/images/Insights/Infoboards/Creating-Infoboard/ask-ai-screen.png)

### Posting a Question to AI

You can ask AI a question based on the available data and add the resulting visualisation to your Infoboard.


![ask ques](/images/Insights/Infoboards/Creating-Infoboard/loanamountcredit.png)

AI analyses the data related to your question and creates relevant visualisations. You can browse through them and select a suitable chart to include in your Infoboard.


![analysed data](/images/Insights/Infoboards/Creating-Infoboard/analyseddata.png)
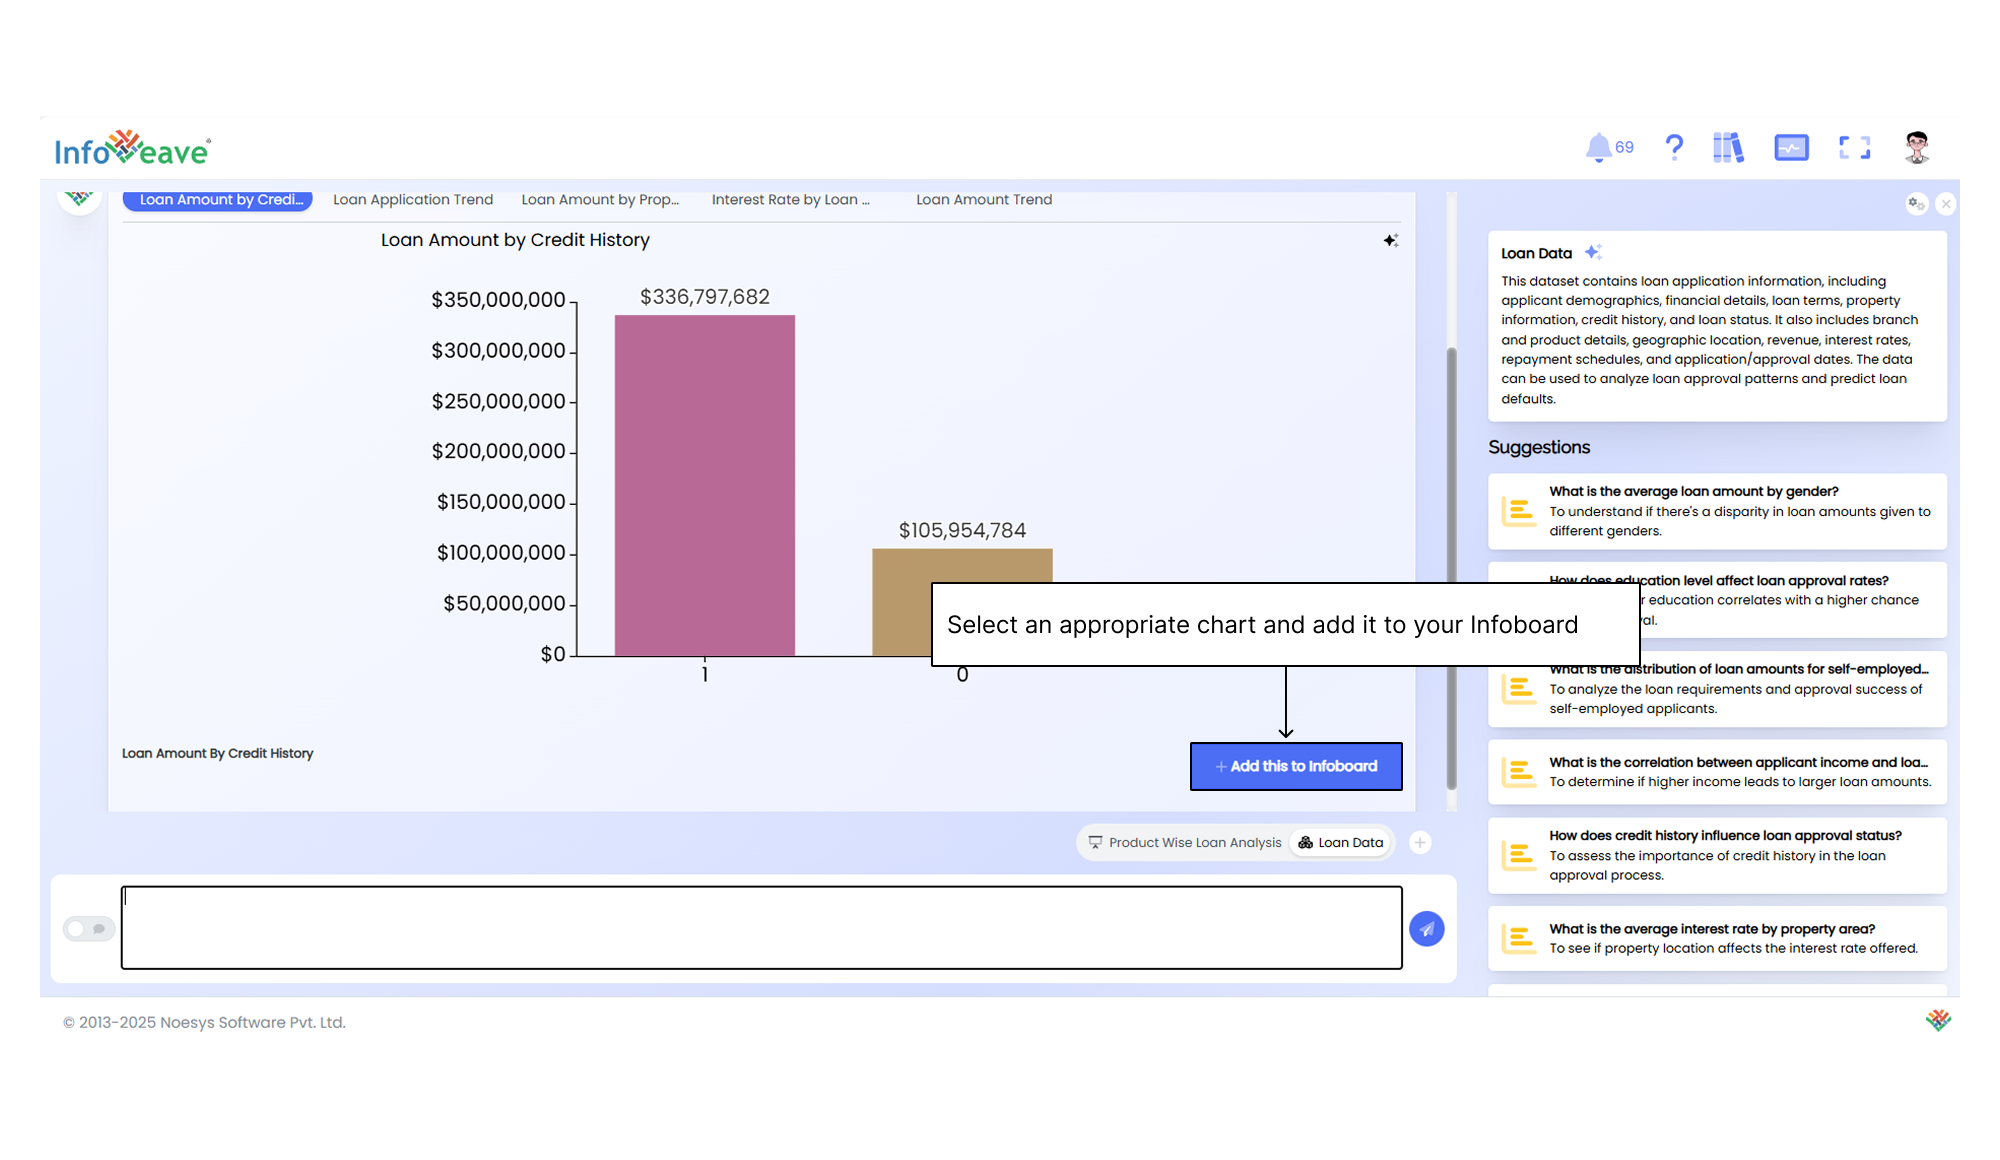
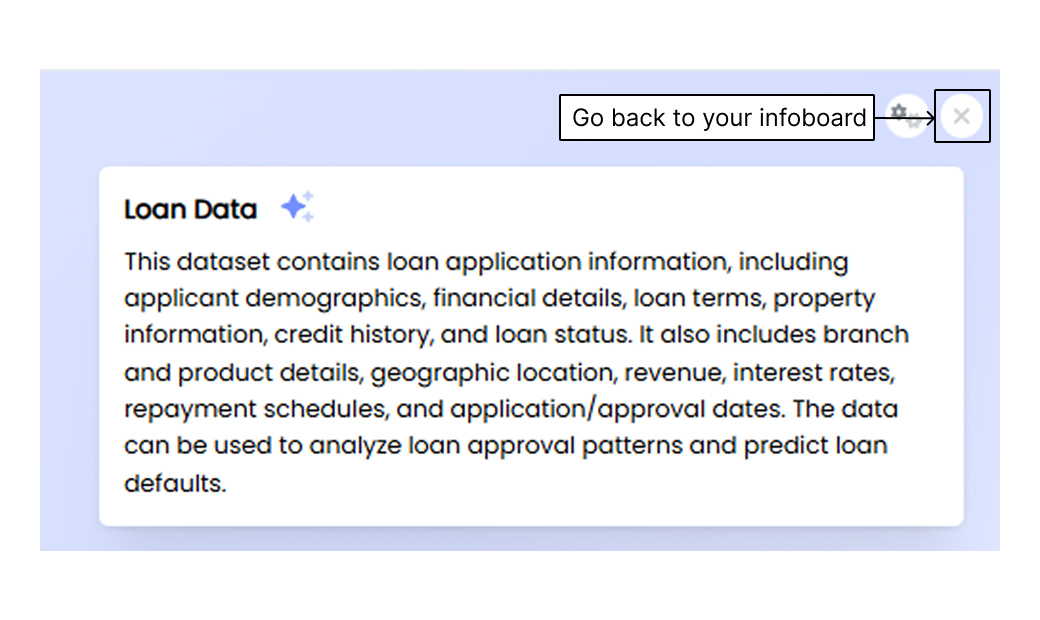
Click on the Close button to return to the Infoboard view.
![close](/images/Insights/Infoboards/Creating-Infoboard/close.png)

<Aside>  
- You can [add and configure more widgets](/insights-v8/create-infoboard/#adding-widgets) to the same Infoboard. You can also configure AI-generated widgets to fine-tune them further.  
- [Customize widget](/insights-v8/create-infoboard#customizing-widgets) appearance to match your theme.  
</Aside>

### Saving and Viewing an Infoboard

![Edit-Infoboard](/images/Insights/Infoboards/Creating-Infoboard/Edit-Infoboard.jpg)

Save and preview your completed Infoboard to ensure that the data and design support your data storytelling goals.

<Steps>  
  1. Click on **Save** to store the completed Infoboard.  
  2. Click on the **View** icon to preview the completed Infoboard.  
</Steps>

<Aside>  
  To learn more about managing Infoboard, visit [Managing Infoboard](/studio-v8/infoboards).  
</Aside>
