Block Matrix
The Block Matrix Chart is a powerful matrix-style scatter visualization that compares two categorical dimensions arranged along the X-axis and Y-axis. Each intersection point on this grid is represented by a symbol (typically a circle or square), with its size indicating the magnitude of a numerical measure.
Unlike traditional heatmaps that rely solely on color shading, Block Matrix Charts provide an intuitive and visually rich way to identify patterns by encoding values through symbol size. Optional color gradients via heatmap scaling can also be applied to further highlight variations in data.
This chart type is particularly useful when analyzing the relationships and distribution between two categorical variables alongside a quantitative metric — with a required group dimension for creating multiple series within the matrix.
Use cases:
- Comparing sales revenue across regions (X-axis) and product categories (Y-axis) segmented by sales channel (Group).
- Visualizing error counts by error type, application module, and environment (Group).
- Mapping survey response distributions across multiple demographics and response options.
- Reviewing stock levels across warehouses and product SKUs, grouped by supply source.
⚙️ Setup
- Drag the Block Matrix Chart widget from the chart library onto your designer workspace.
- Select the chart.
- Go to the Widget Configuration tab in the Customize panel.
- Under the Configuration tab, select the Basic Configuration option to access the essential settings for the block matrix chart.
- Select the Source which the chart will pull the data from the option.
- Map:
- Measure (Value) — Numerical value determining symbol size.
- Dimension XAxis — Categorical field for horizontal grouping.
- Dimension YAxis — Categorical field for vertical grouping.
- Group — Required dimension for separating data into multiple series.
- Optionally add a Date field for time-based filtering.
- Enable Hide Zero Values to omit symbols with zero values if needed.
📊 Basic Configuration
| Configuration Item | Description |
|---|---|
| Source | Source providing the data for measures and dimensions. |
| Measure (Value) | Numeric value that determines symbol size. |
| Dimension XAxis | Categorical value for horizontal axis grouping. |
| Dimension YAxis | Categorical value for vertical axis grouping. |
| Group | Required — Categorical field for grouping multiple series. |
| Date Field (optional) | Date dimension for time-based data filtering. |
| Hide Zero Values | Option to suppress symbols with zero value from display. |
🎨 Chart Customizations
| Category | Options & Description |
|---|---|
| General | Modify the chart’s general appearance, including the background color, borders, shadows, and drill-out choices. |
| Title | Enable and customize chart title text, alignment, font, and color. |
| Sorting | Define custom sort orders for categories along the X and Y axes. |
| Grid | Adjust chart margins, grid spacing, and padding around the matrix area. |
| Legend | Toggle visibility, position, orientation, and customize legend labels and icons. |
| HeatMap | Configure a visual color map to represent value intensity with a gradient. |
| Categorical Axis (X, Y) | Customize axis labels, intervals, rotation, visibility, and range sliders for both axes. |
| Series | Style symbols: adjust size ranges, enable stacking, toggle labels, and set symbol offset for multiple series. |
| Tooltip | Control tooltip content, formatting, and visibility on hover. |
| Others | Set Symbol Minimum Size, Symbol Maximum Size, and manage offset scaling for clear separation between grouped series. |
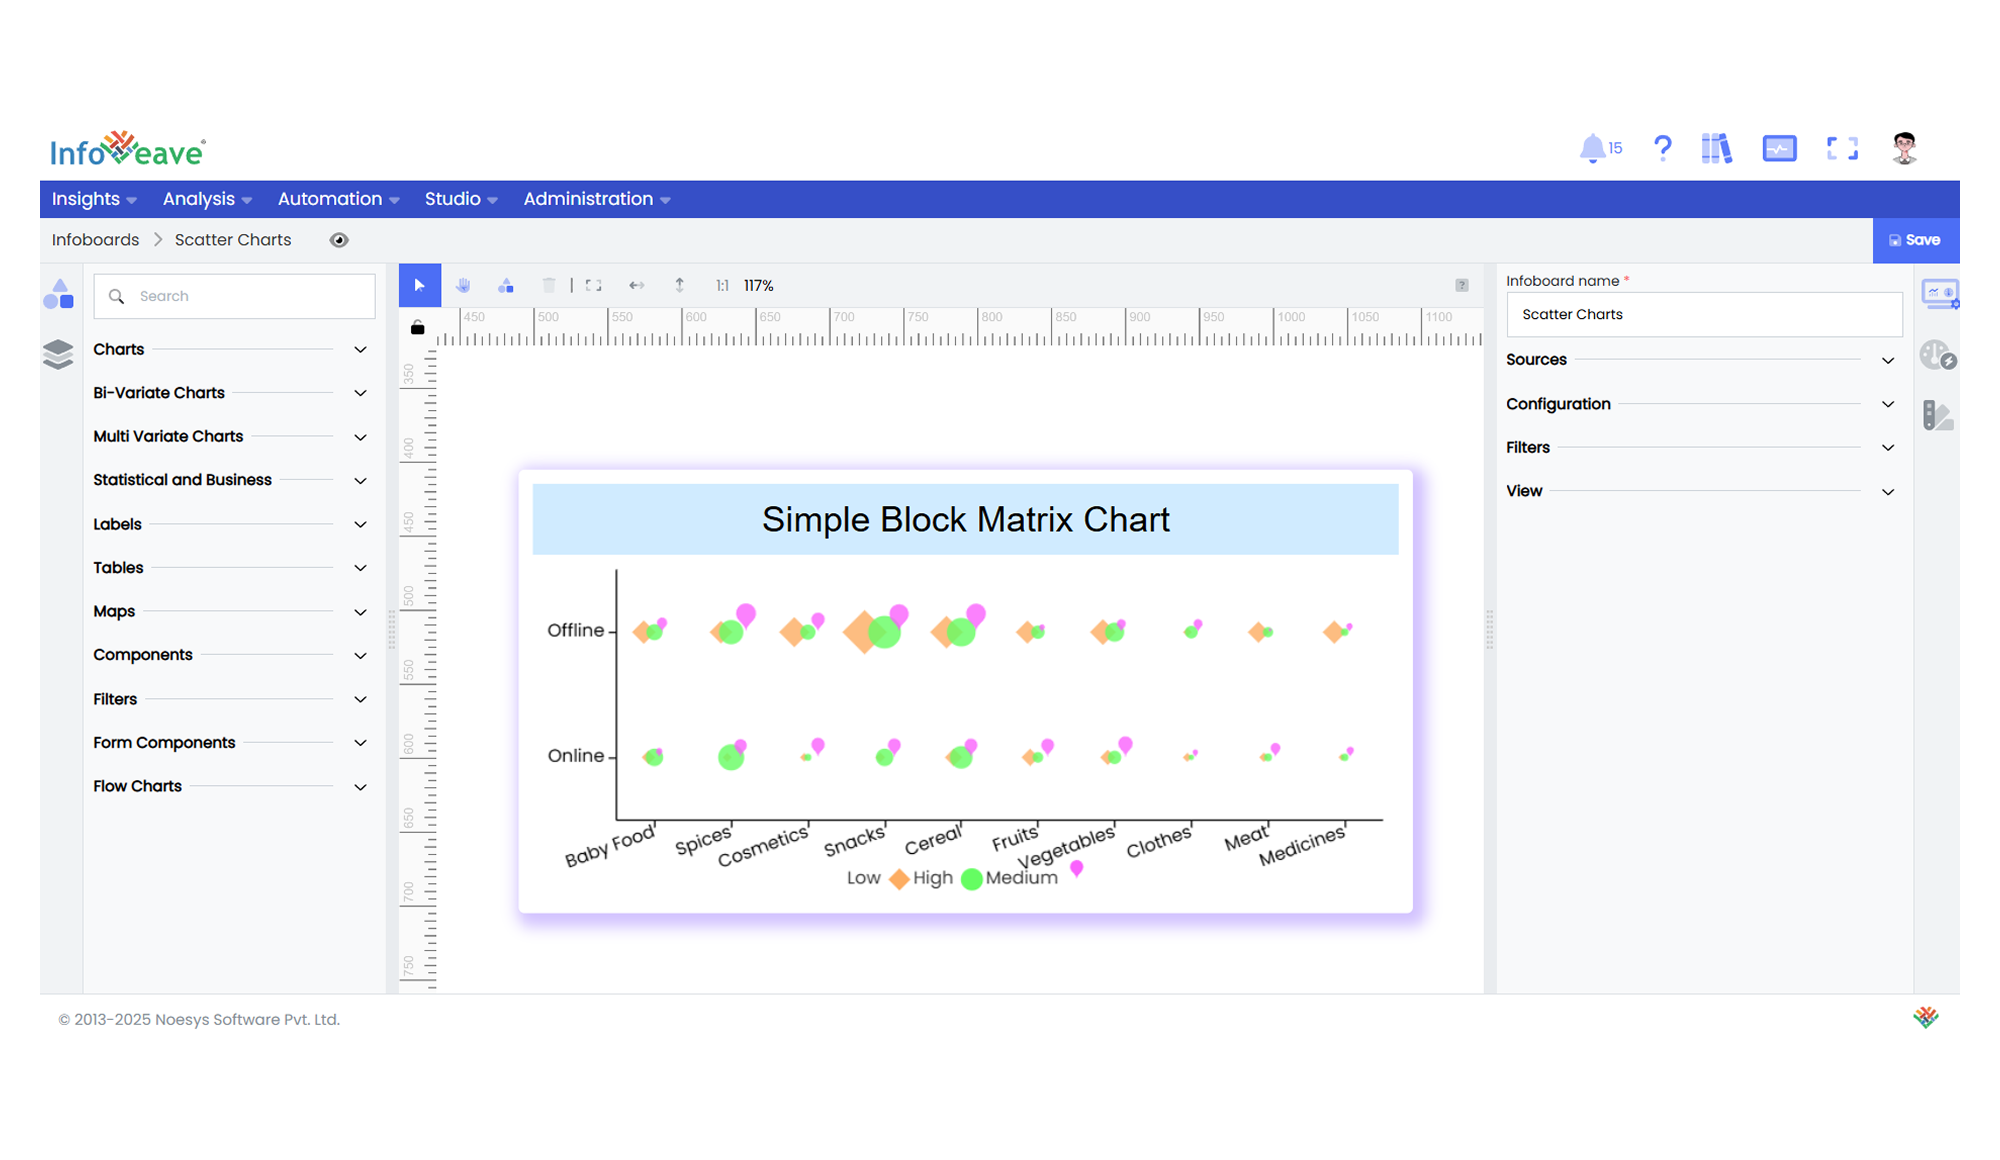
📊 Example Visualization