
Viewing Infoboards
This section gives you a detailed explanation of the available options when viewing an Infoboard.
Editing an Infoboard
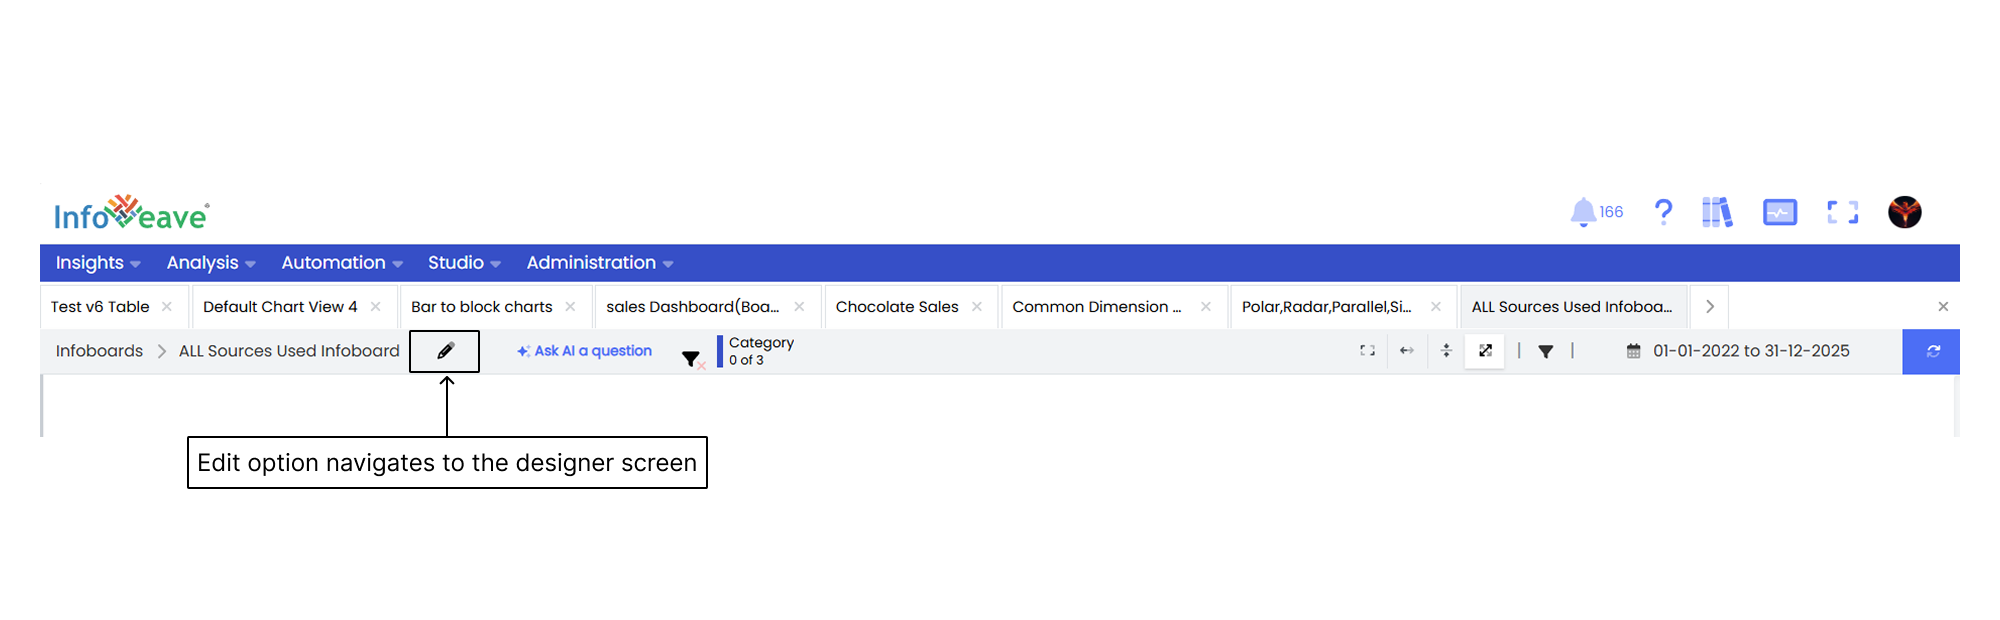
When you click the pencil icon, you are taken directly to the designer view where you can edit and customize the Infoboard.
Saving and Viewing an Infoboard
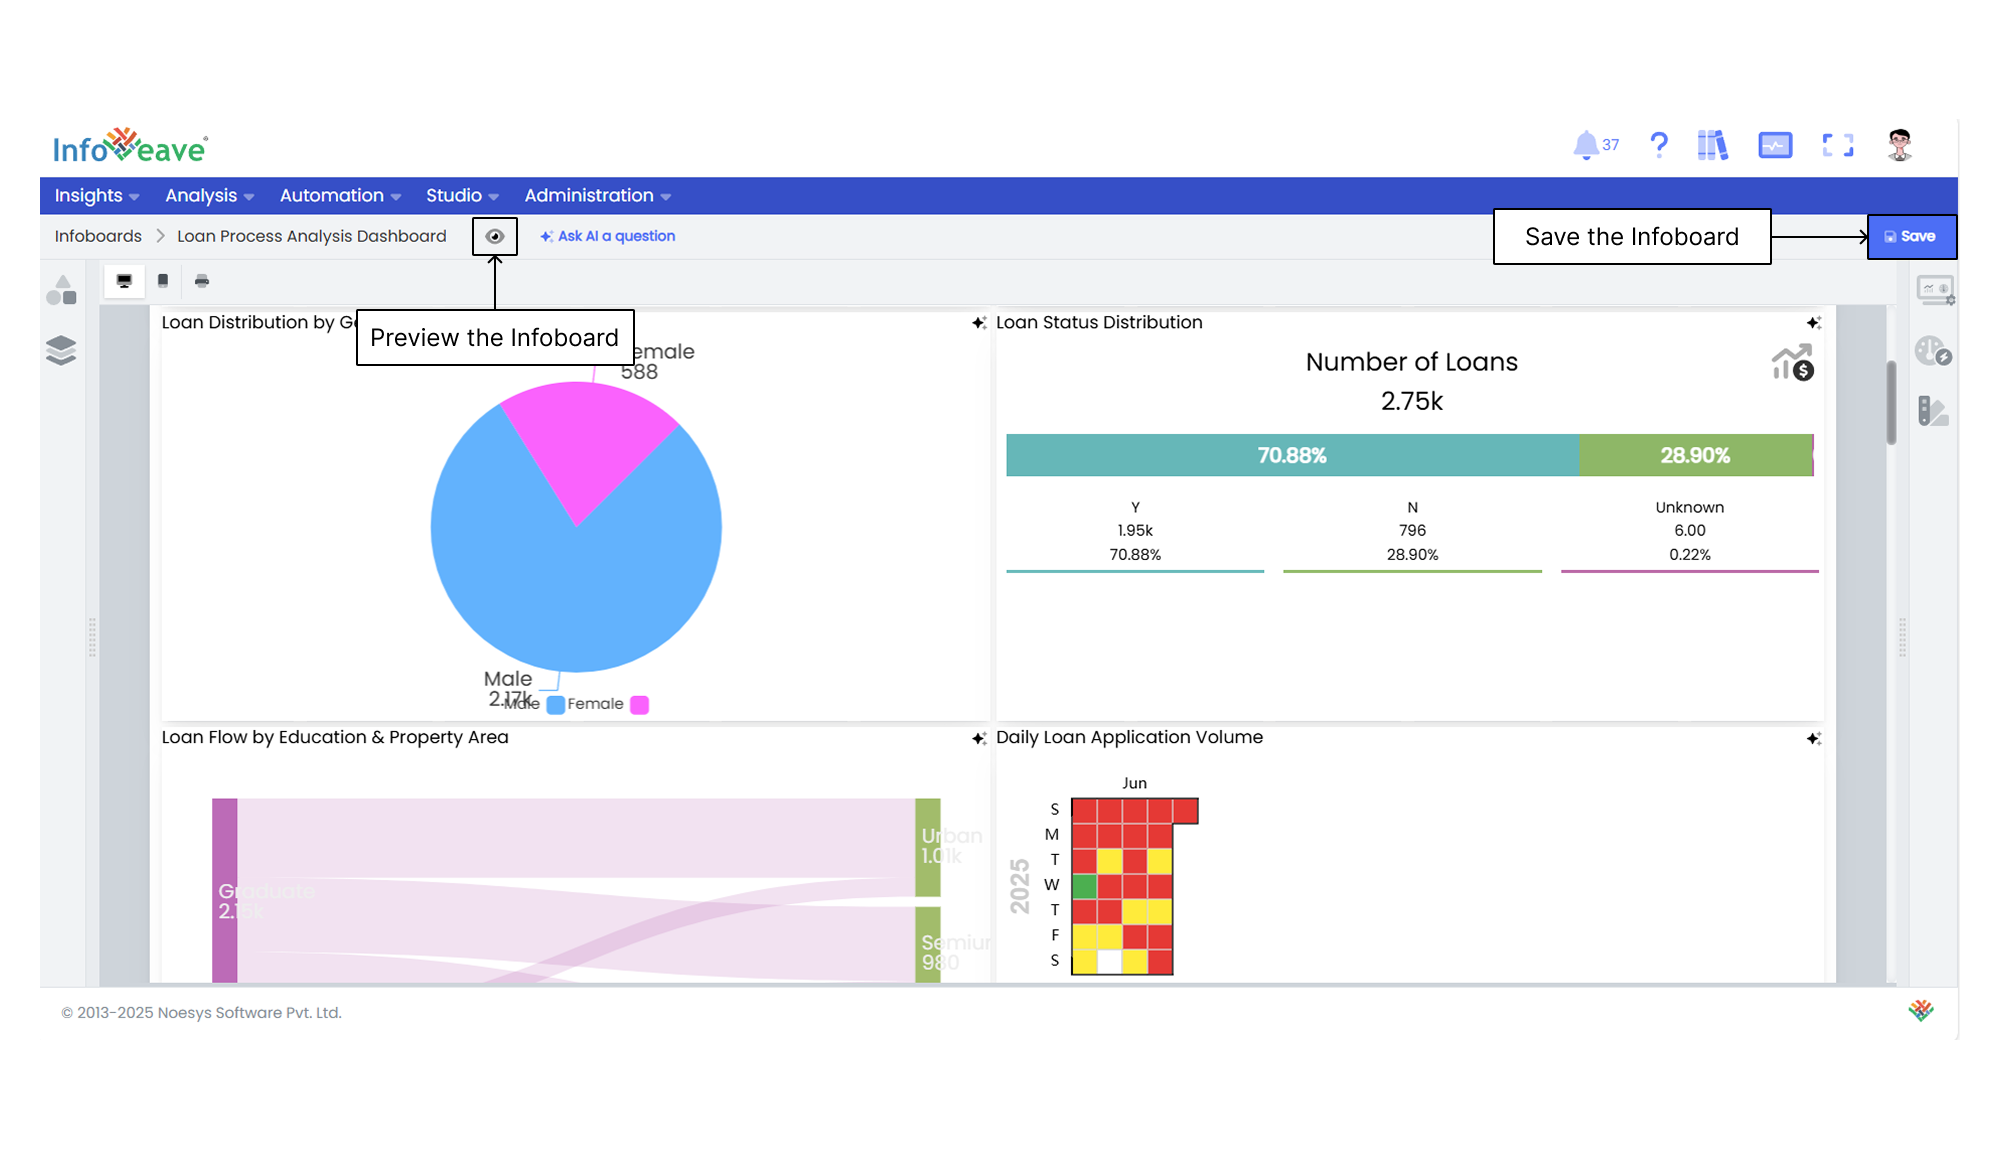
Save and preview the completed Infoboard to ensure the data and design align with your data storytelling goals.
- Click Save to save the completed Infoboard.
- Click the View icon to preview the completed Infoboard.
Asking AI a Question
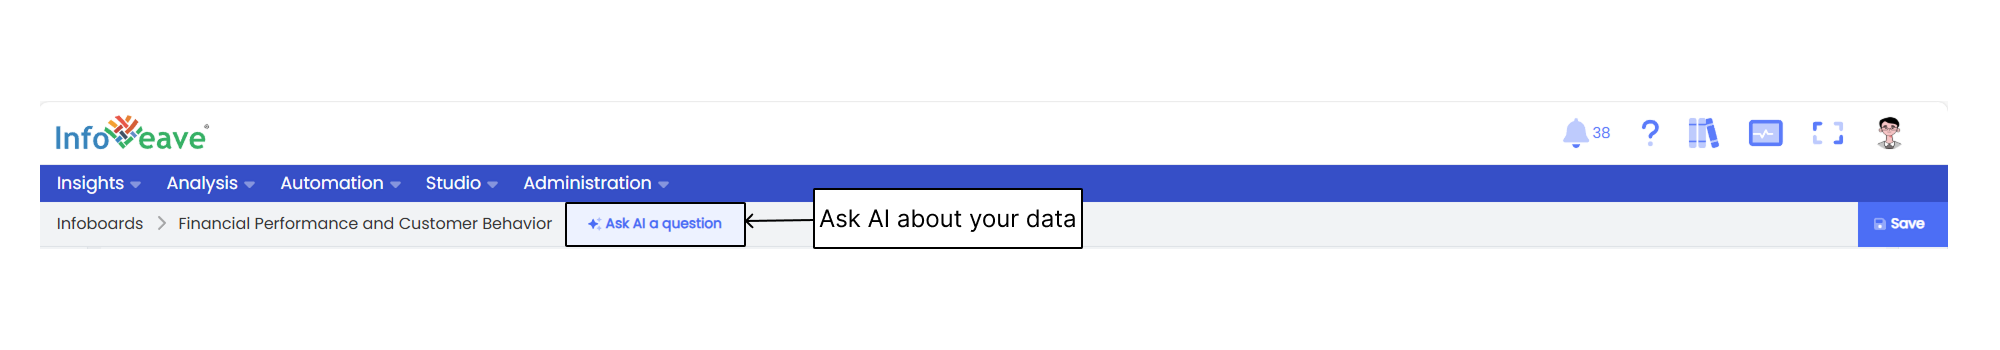
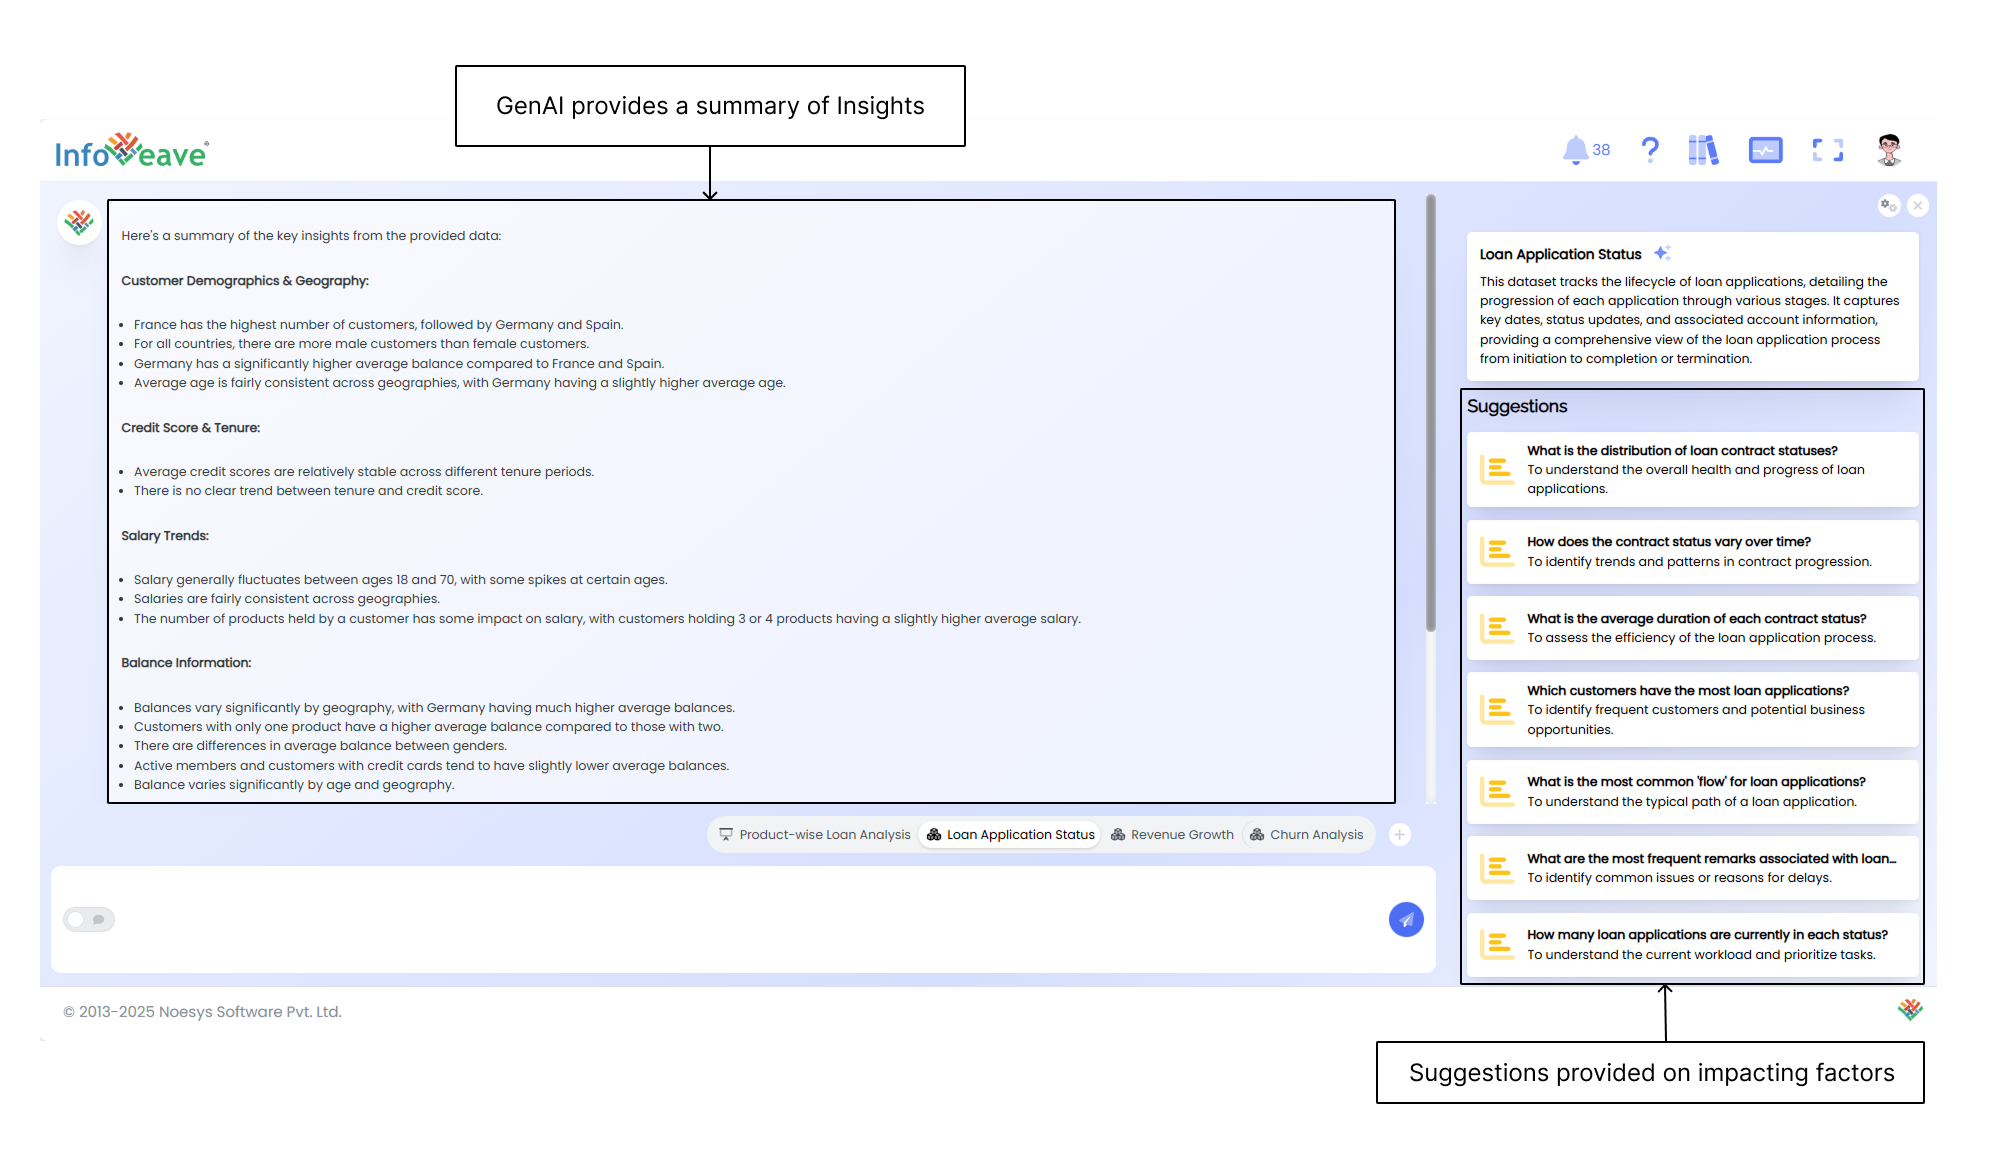
When you click this option, GenAI provides a summary of insights, data, and suggestions on key factors affecting the KPIs.
Posting a Question to AI
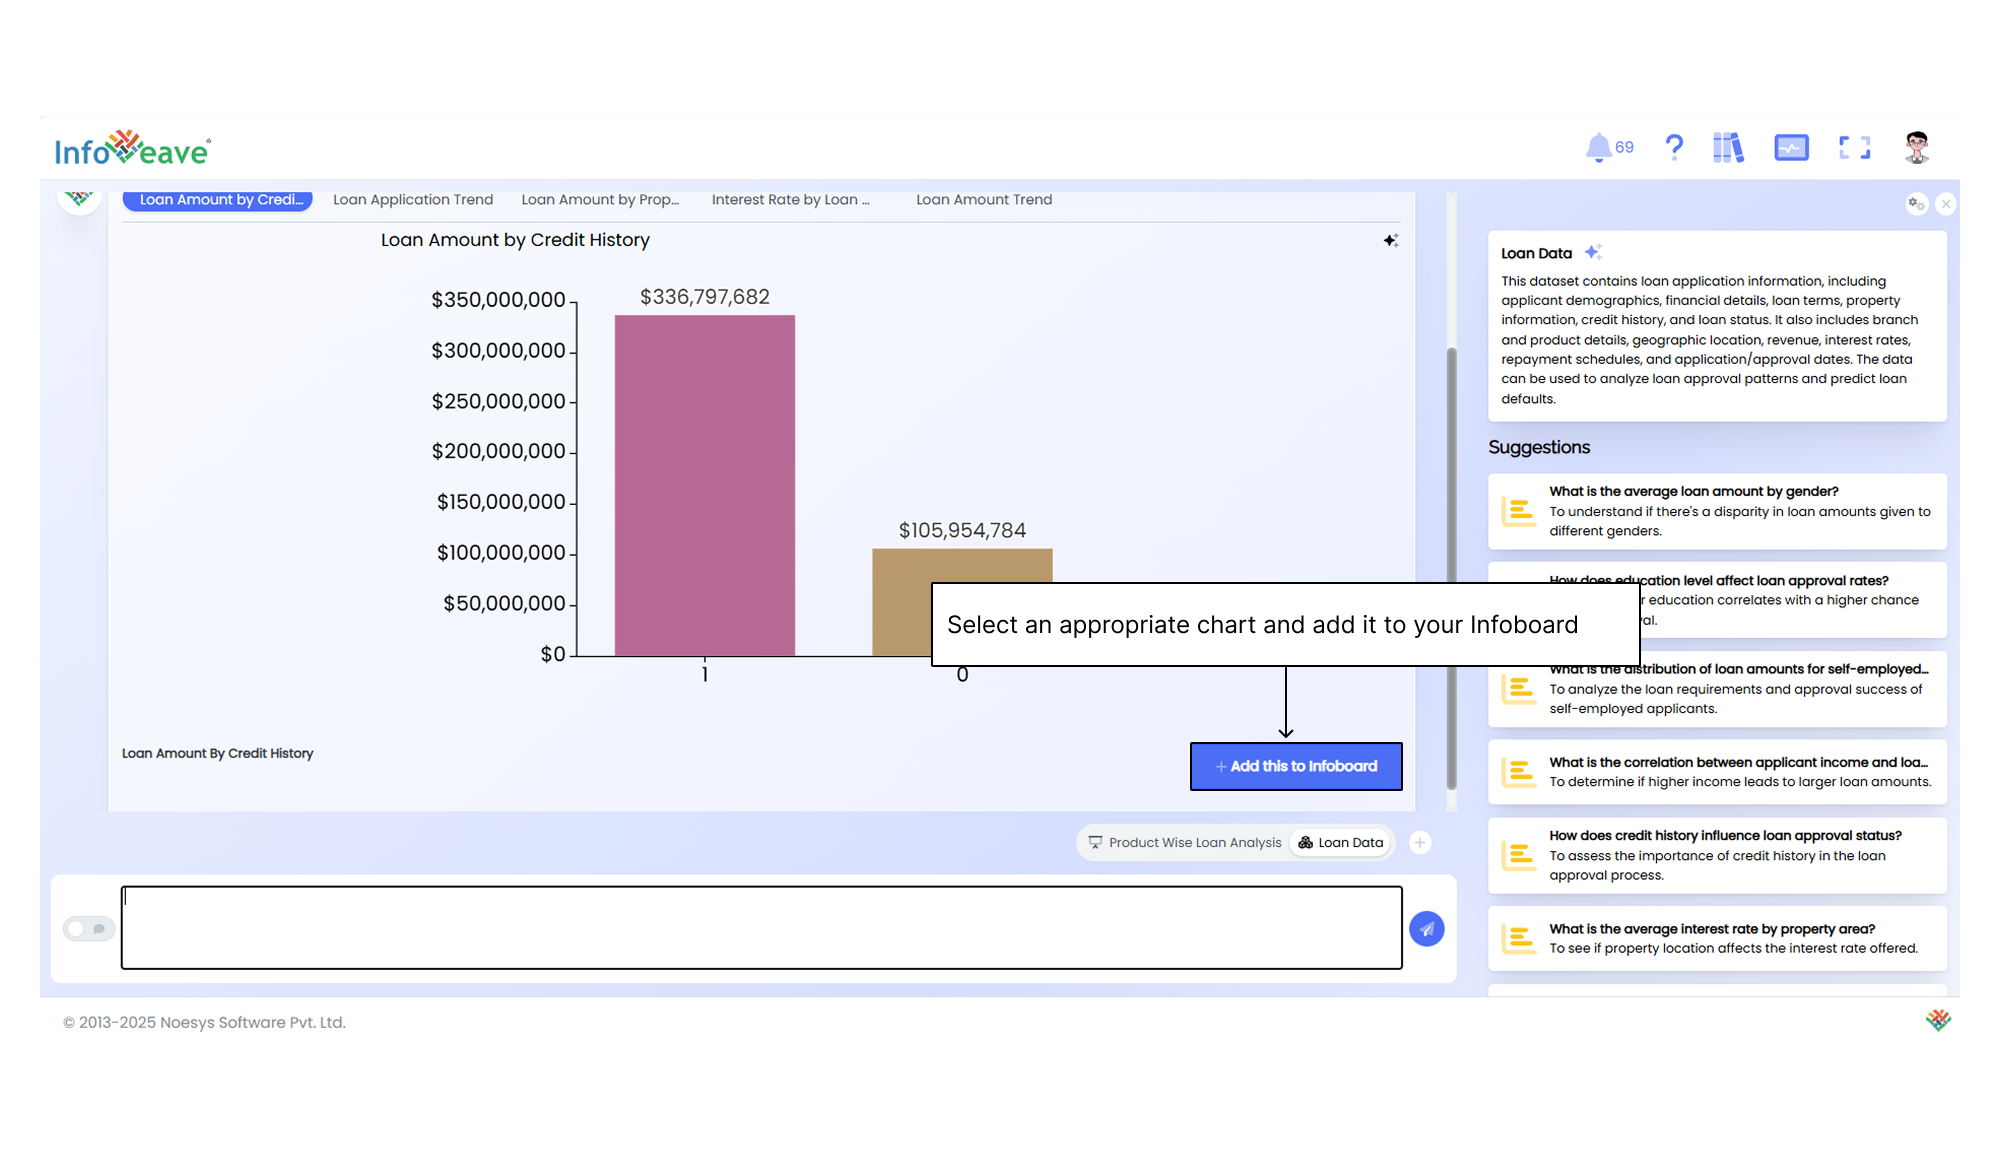
You can ask a question based on the data and add the resulting visualization to the Infoboard.
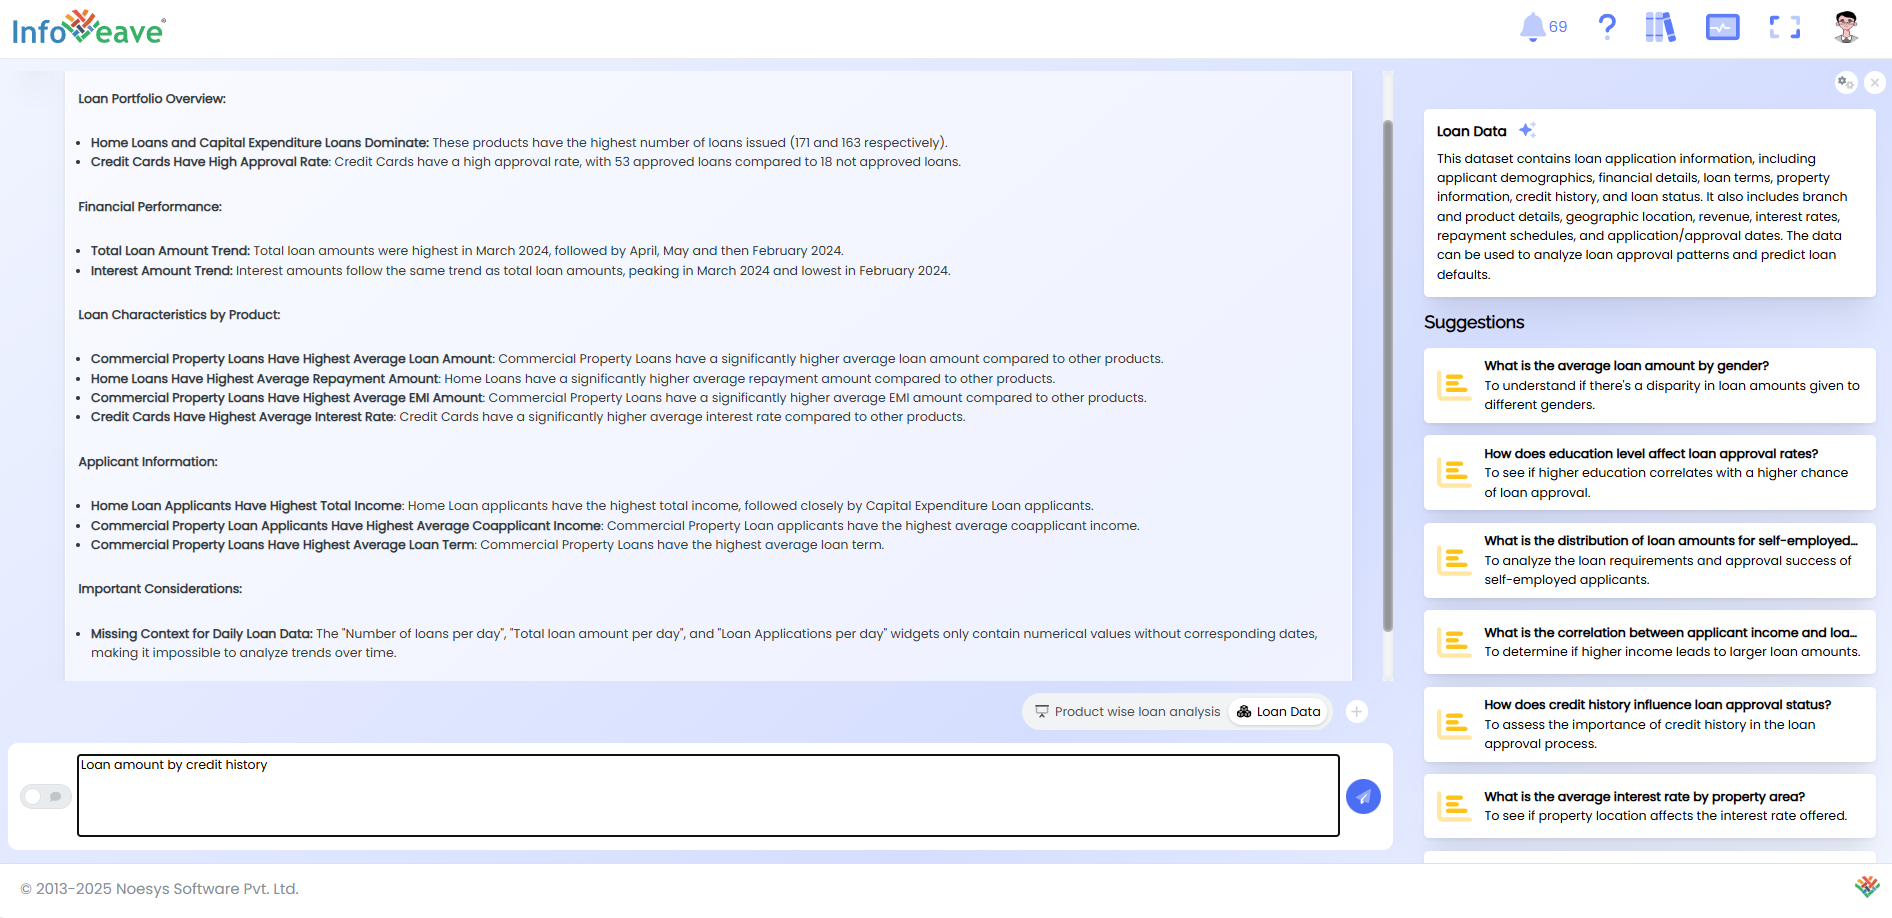
AI analyzes the data according to your question and generates relevant visualizations. You can browse through them and select a suitable chart to include in your Infoboard.
Viewing Options
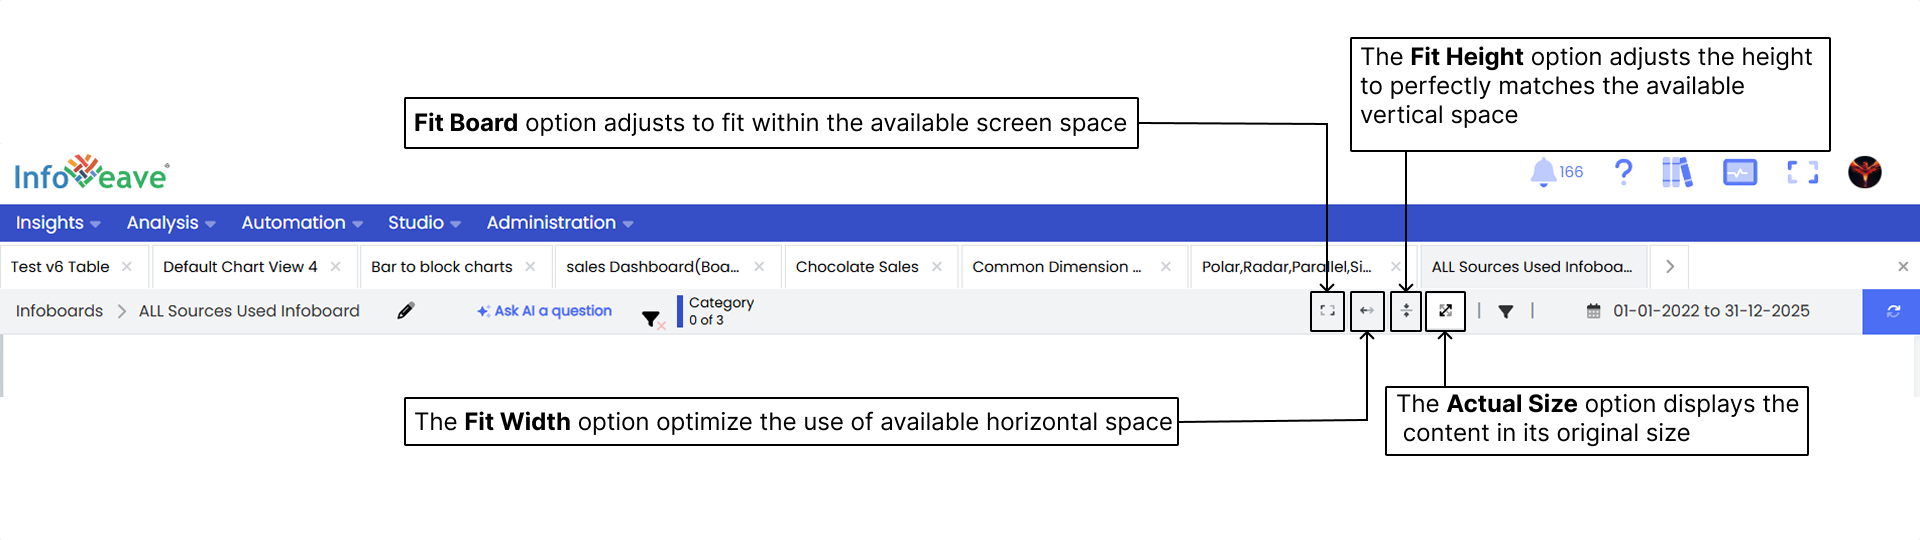
- Fit Board optimizes the view of your Infoboard for better visibility and experience. It automatically adjusts the Infoboard to fit the screen, ensuring that all widgets and visualizations are aligned and scaled properly.
- Fit Width adjusts the Infoboard layout to use the full horizontal space. This ensures all widgets are evenly distributed across the screen.
- Fit Height adjusts the content so the height matches the vertical space available, ,while keeping the aspect ratio of widgets and visuals intact.
- Actual Size displays content at its original size, preserving the exact dimensions of widgets and visualizations.
Filtering Data
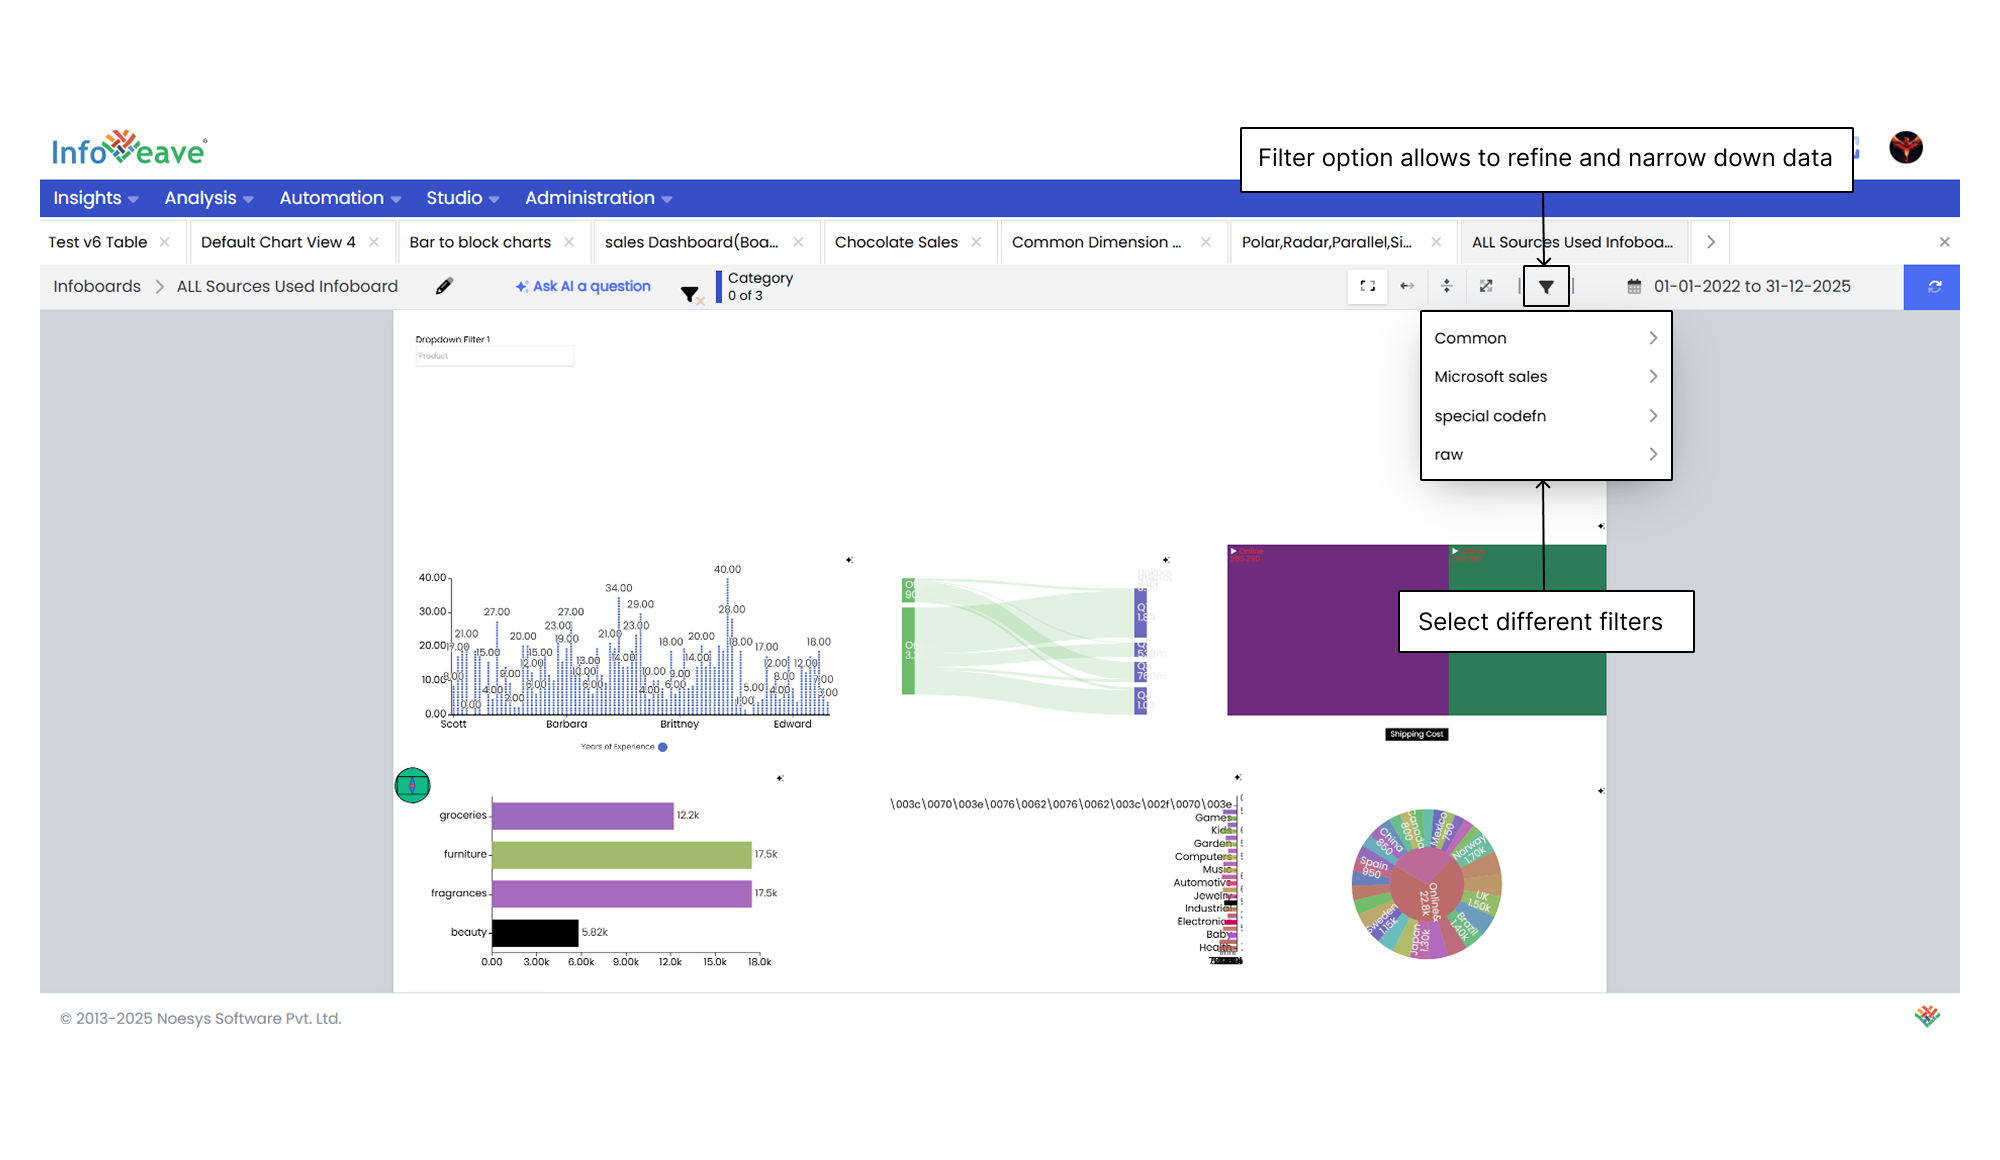
The filter option lets you refine the displayed data using specific criteria. Use the dropdown menu to apply filters and focus on certain subsets of information. This helps with targeted analysis and decision-making based on selected categories or parameters.
Using the Date Range Filter
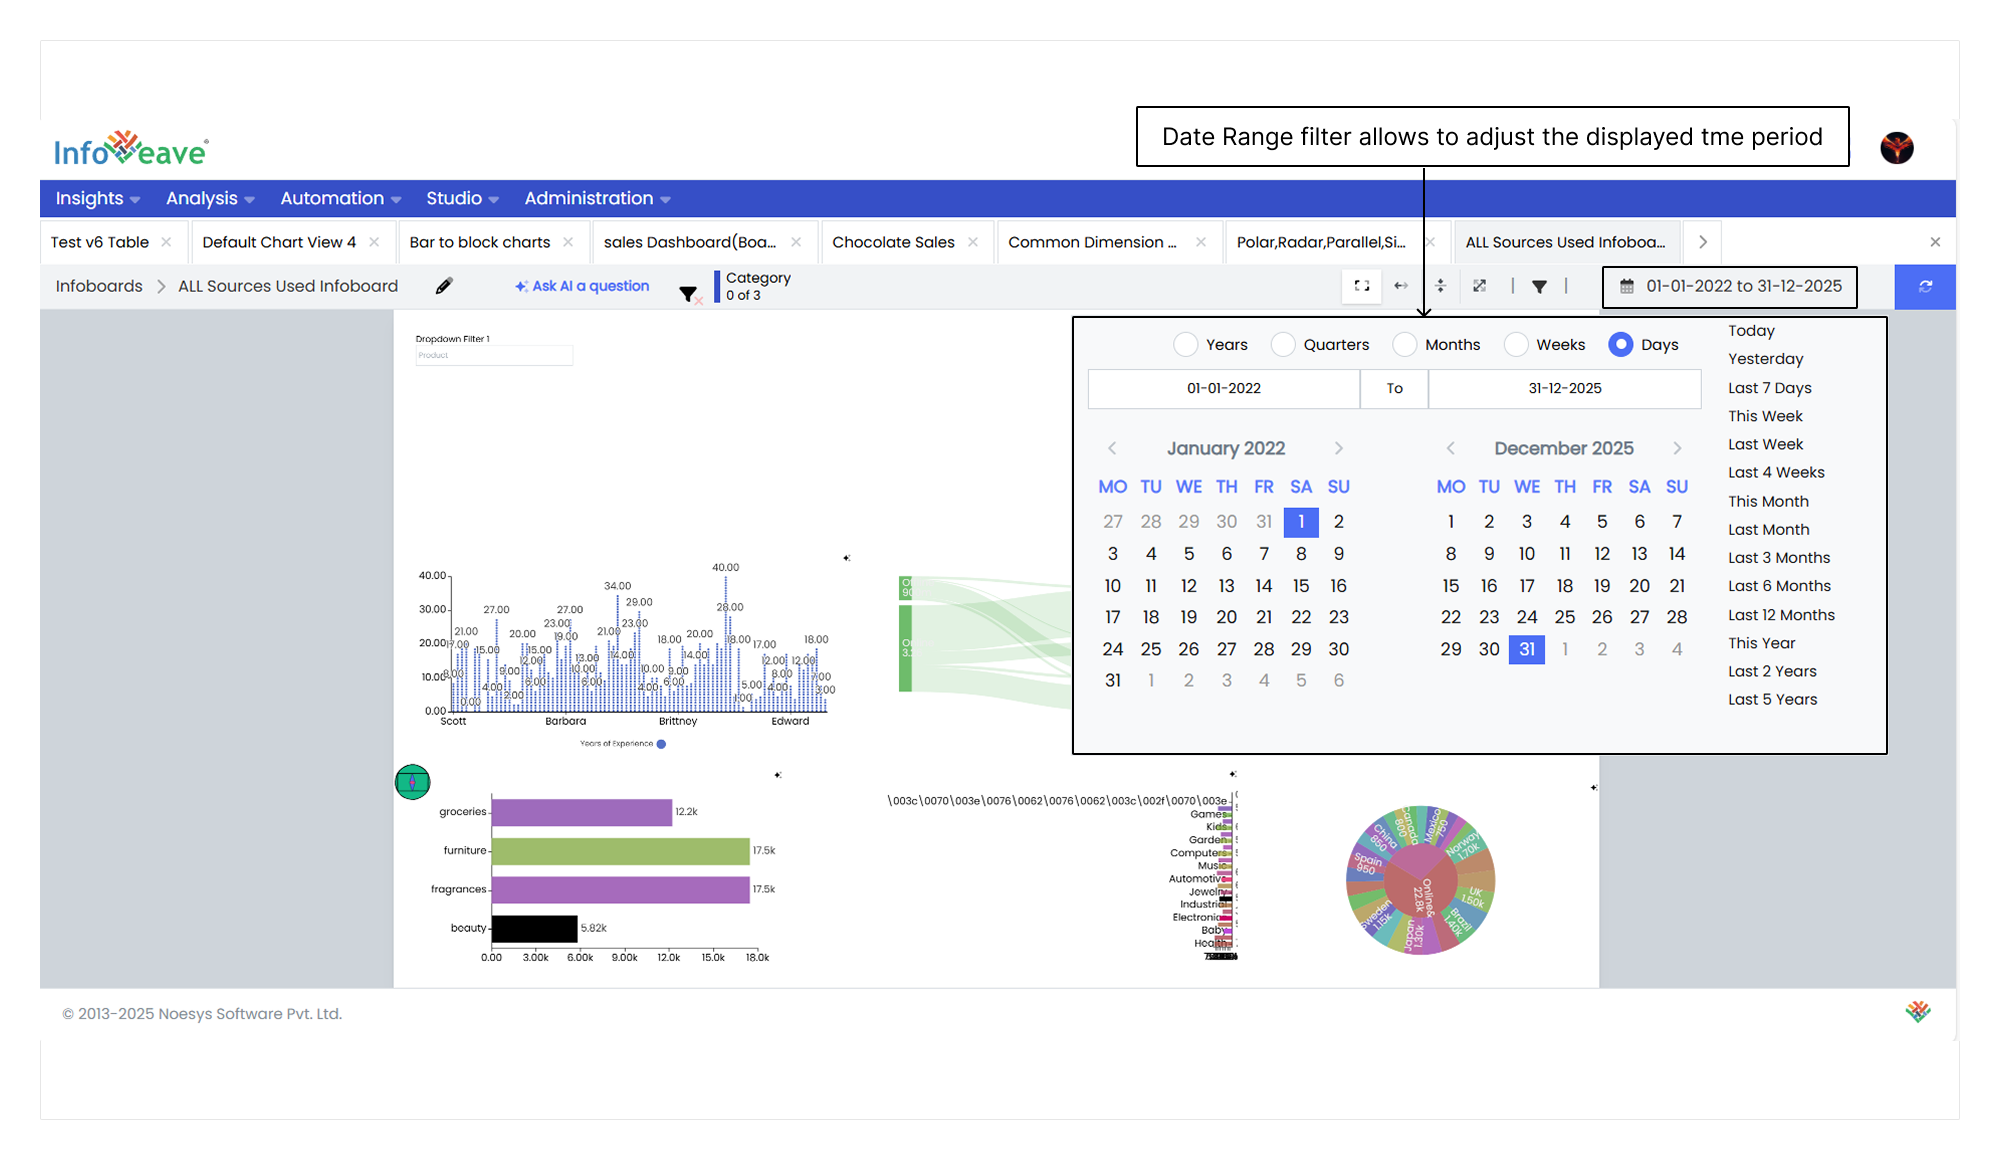
Infoboard date range filters allow you to define a time period for viewing your Infoboard. You can set the range by year, quarter, month, week, or day. Customize these filters to control the timeline shown on the Infoboard.
The date range filter helps you adjust the timeframe shown on your Infoboard.
- Click the Insights module in the Infoveave menu.
- Select the Infoboard where you want to apply the date range filter. You can also use the search option.
- Locate the Date range filter in view mode.
- Click on the Date range filter to see the list of options. The selected date range will apply to all widgets.
- Choose a date range from Year, Quarters, Months, Weeks or Days.
- Click Go to refresh and update the Infoboard.
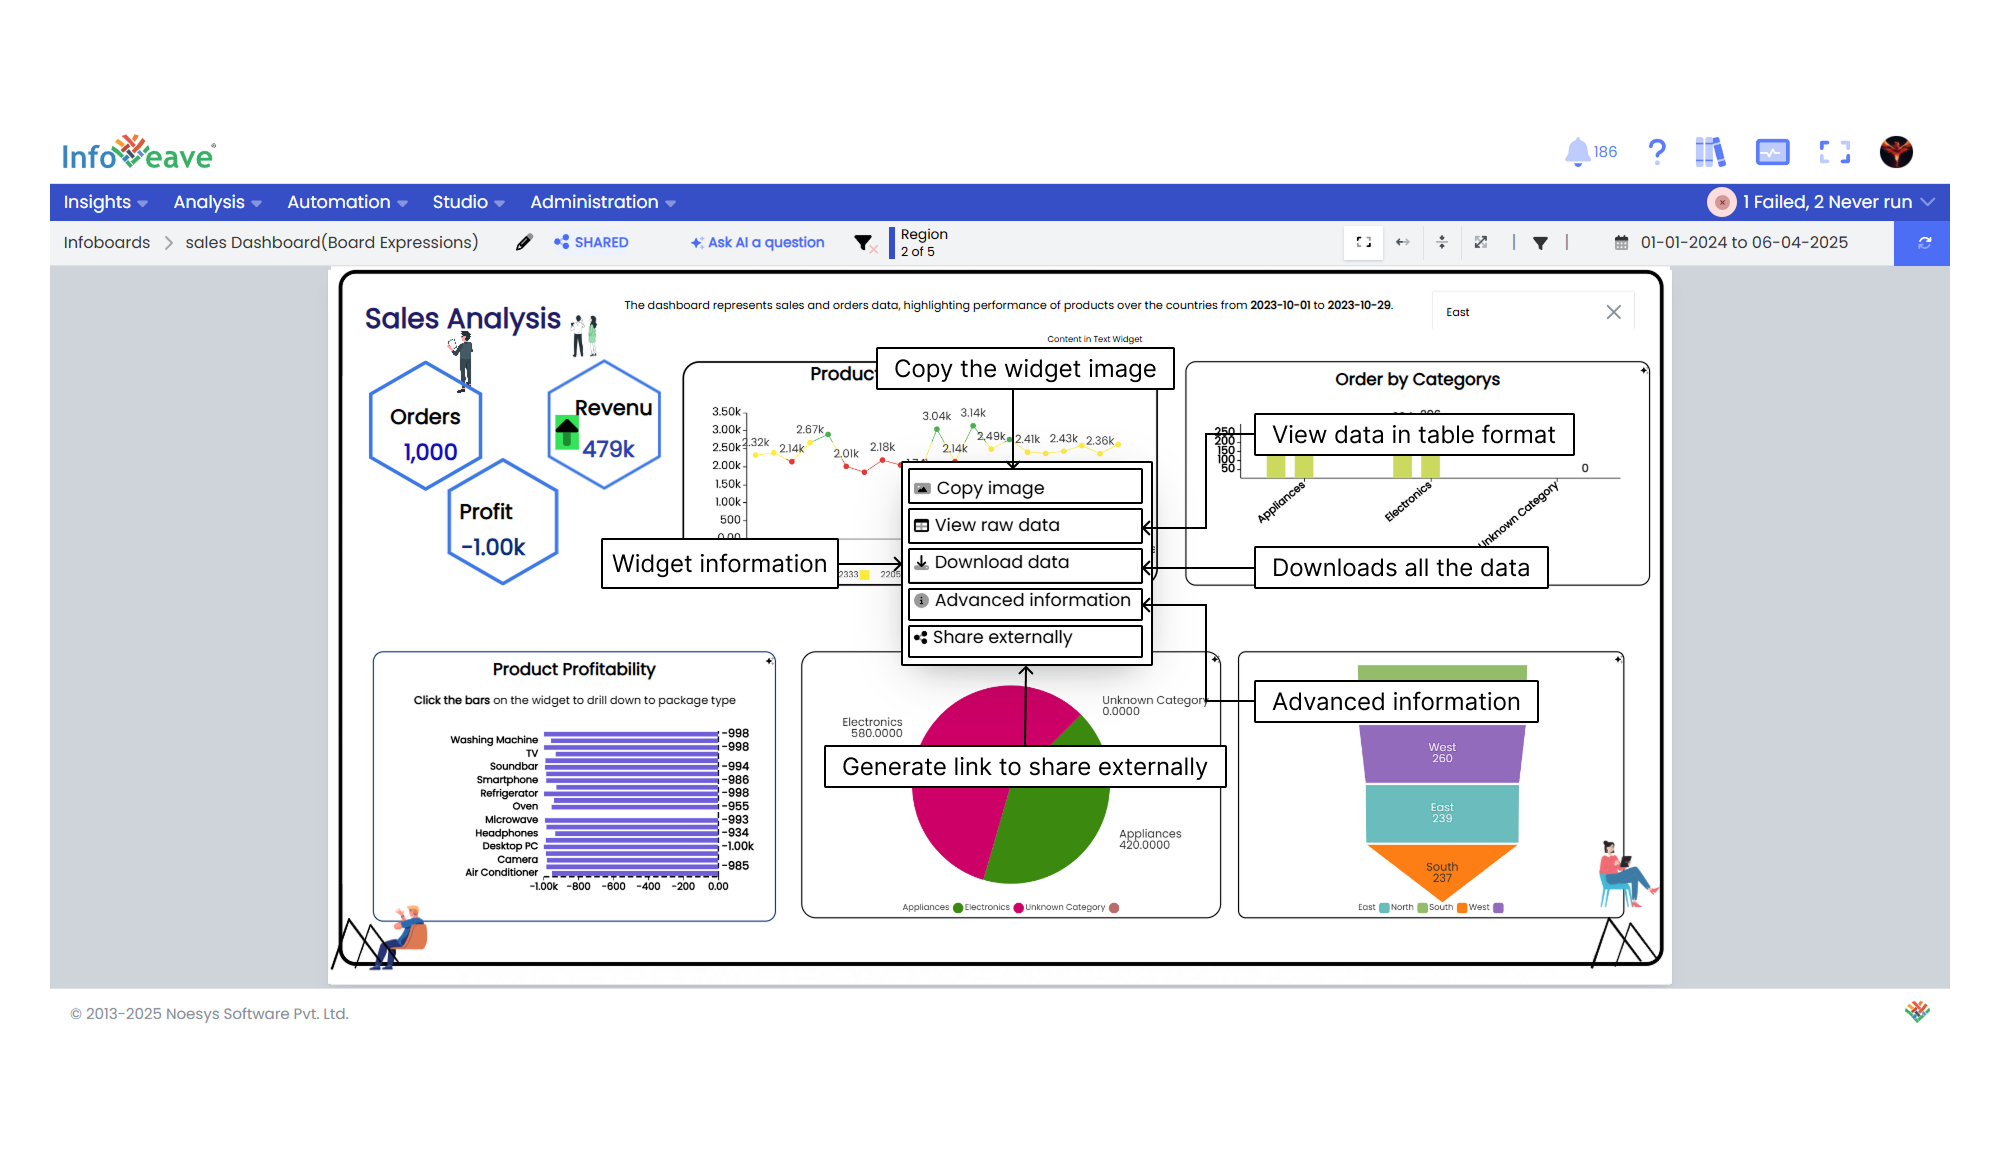
Widget Actions
The Widget actions feature gives you a set of interactive options to manage and analyze data directly from a selected widget.
To view widget actions follow these steps
- Select the widget.
- Right-click the selected widget to view available actions.
Copy image
The Copy image option lets you quickly copy a widget or visual element as an image.
- Select the widget.
- Right-click the widget.
- Click Copy image. A popup will appear.
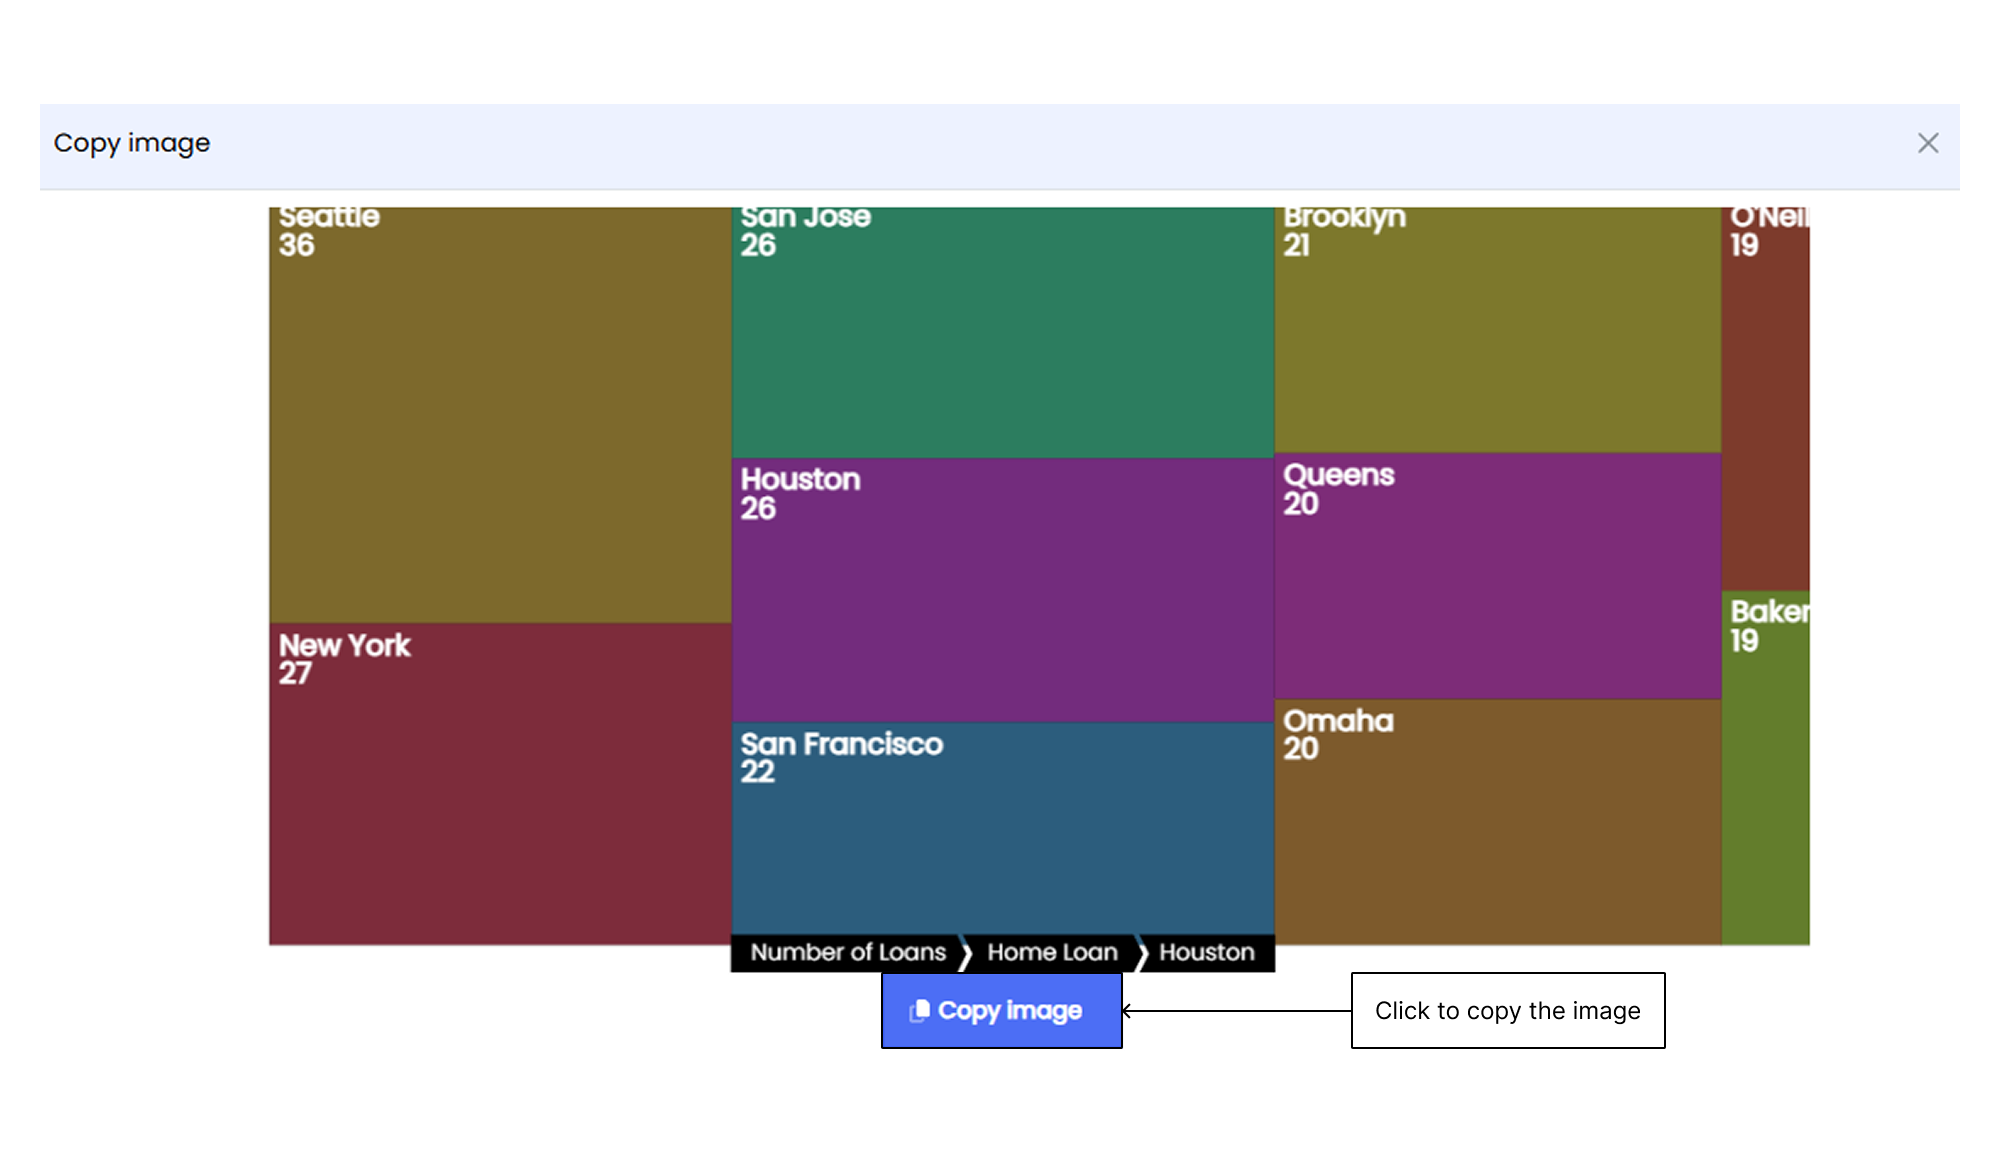
- Click the blue Copy image button to copy the image.
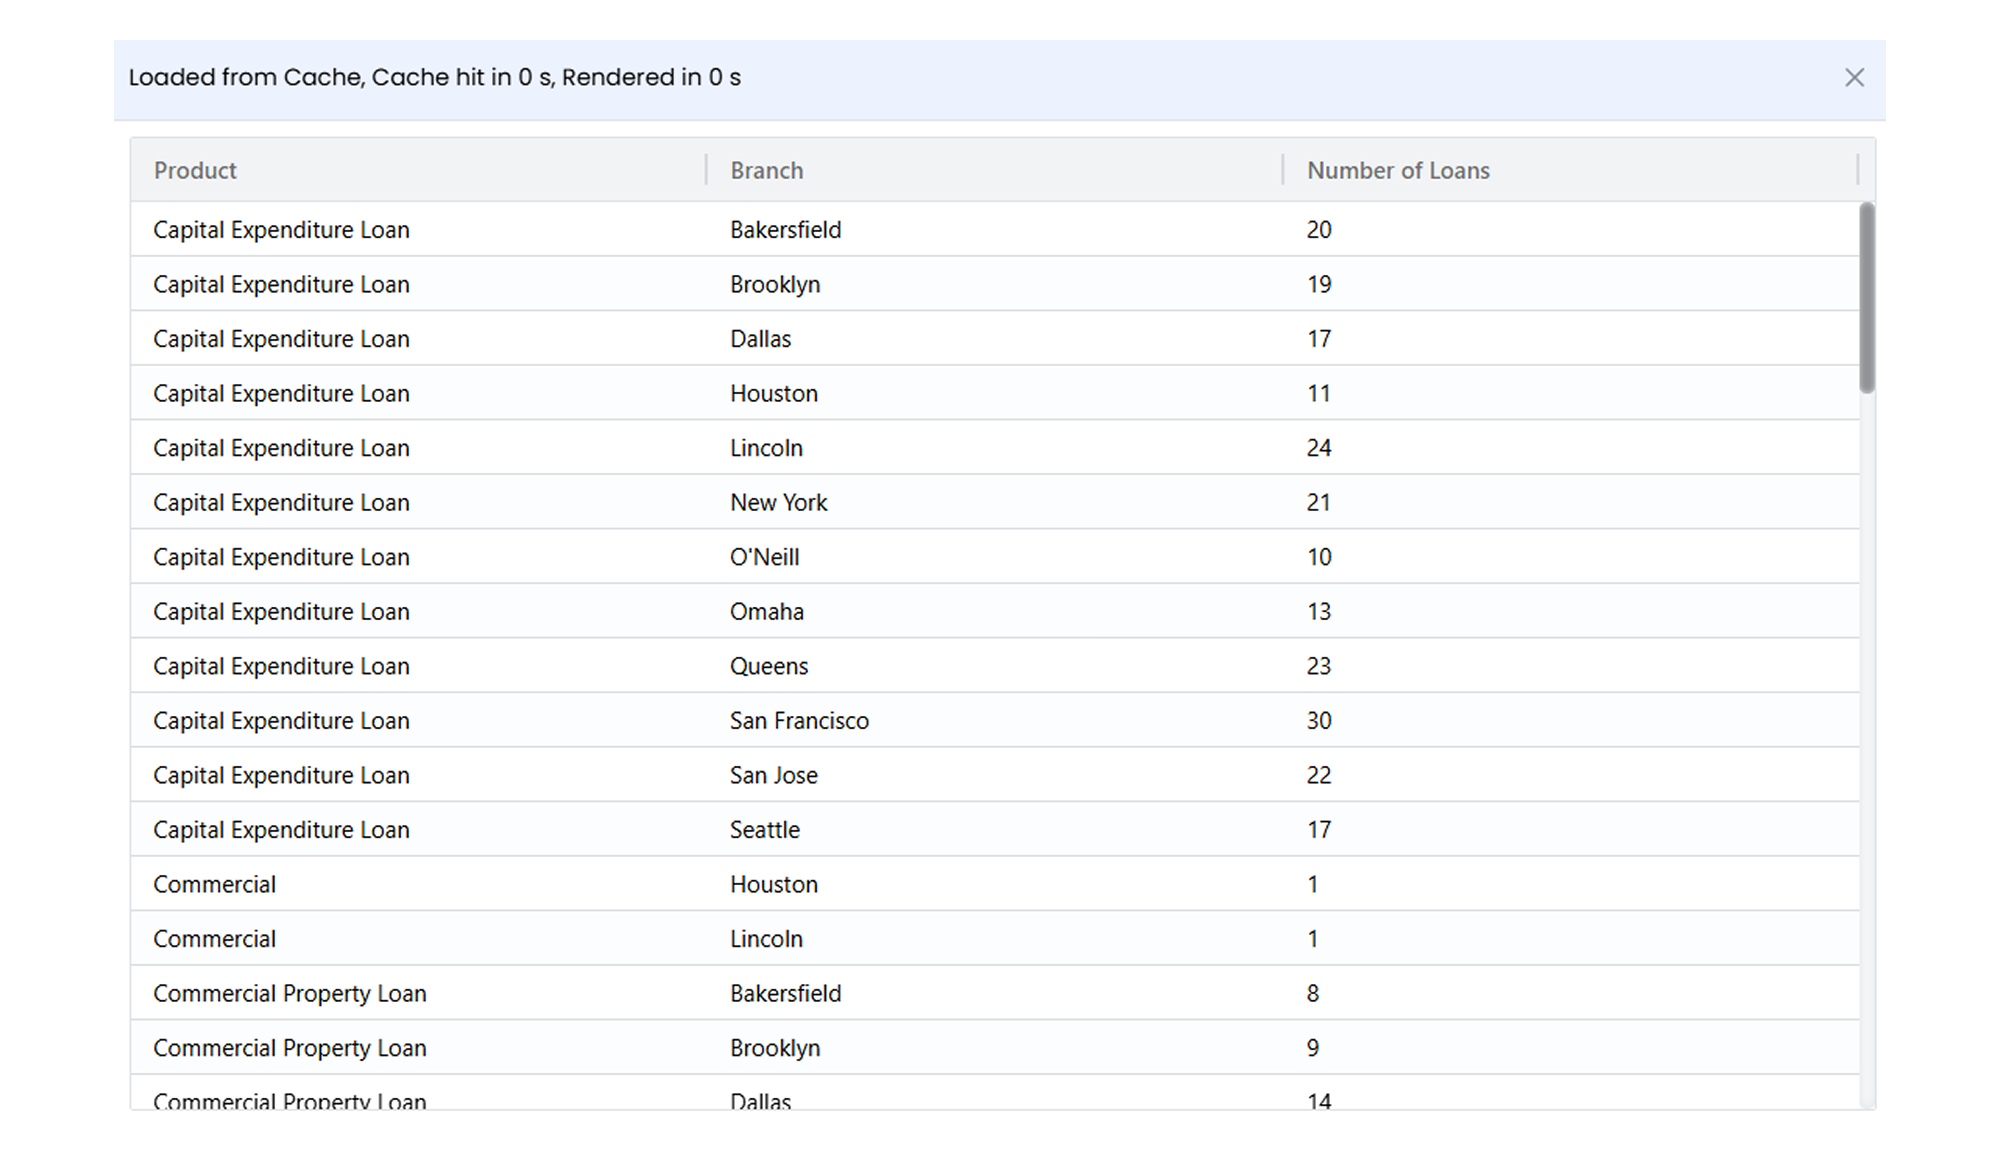
View raw data
The View raw data option allows you to see the underlying data of a widget in a tabular format.
- Select the widget.
- Right-click the widget.
- Click View raw data. A popup will appear with the raw data.
Download data
The Download data option allows you to export the data behind a widget as a downloadable file.
- Select the widget.
- Right-click the widget.
- Click Download data.
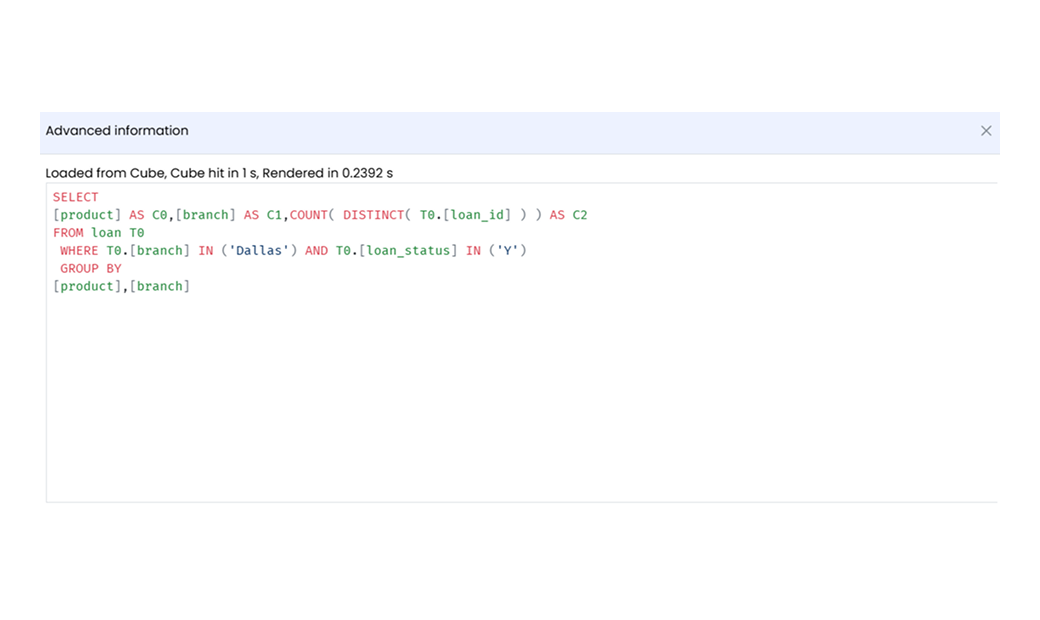
Advanced information
The Advanced Information option shows detailed insights into the data query behind a widget. It displays the SQL query used to fetch and render the data. This is helpful for understanding data processing and for troubleshooting or improving performance.
- Right-click the widget.
- Click Advanced information to view the query.
Share an Infoboard or Widget publicly
The Share externally option allows you to share Infoboards or widgets through a public link. It supports multiple viewing formats (desktop, mobile, print) and allows you to apply board dates and filters. You can also enable password protection for security, making it great for collaborative reporting and analysis.
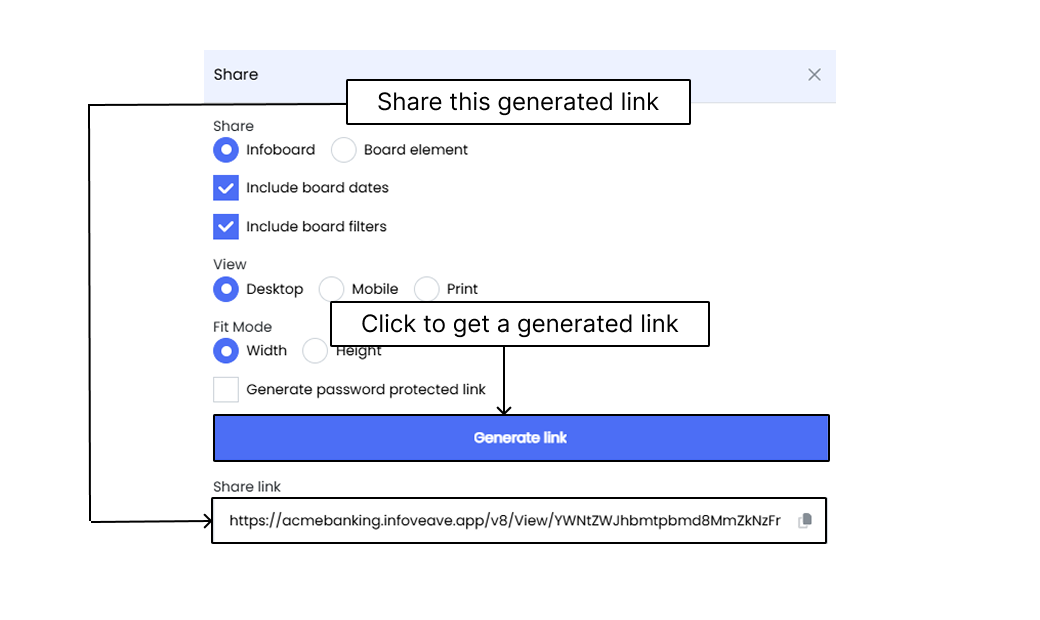
To share Infoboards or widgets publicly
- Right-click the widget you want to share.
- Click the Share externally option.
- Select the checkboxes and click Generate Link to get a public link.
Accessing Linked Reports
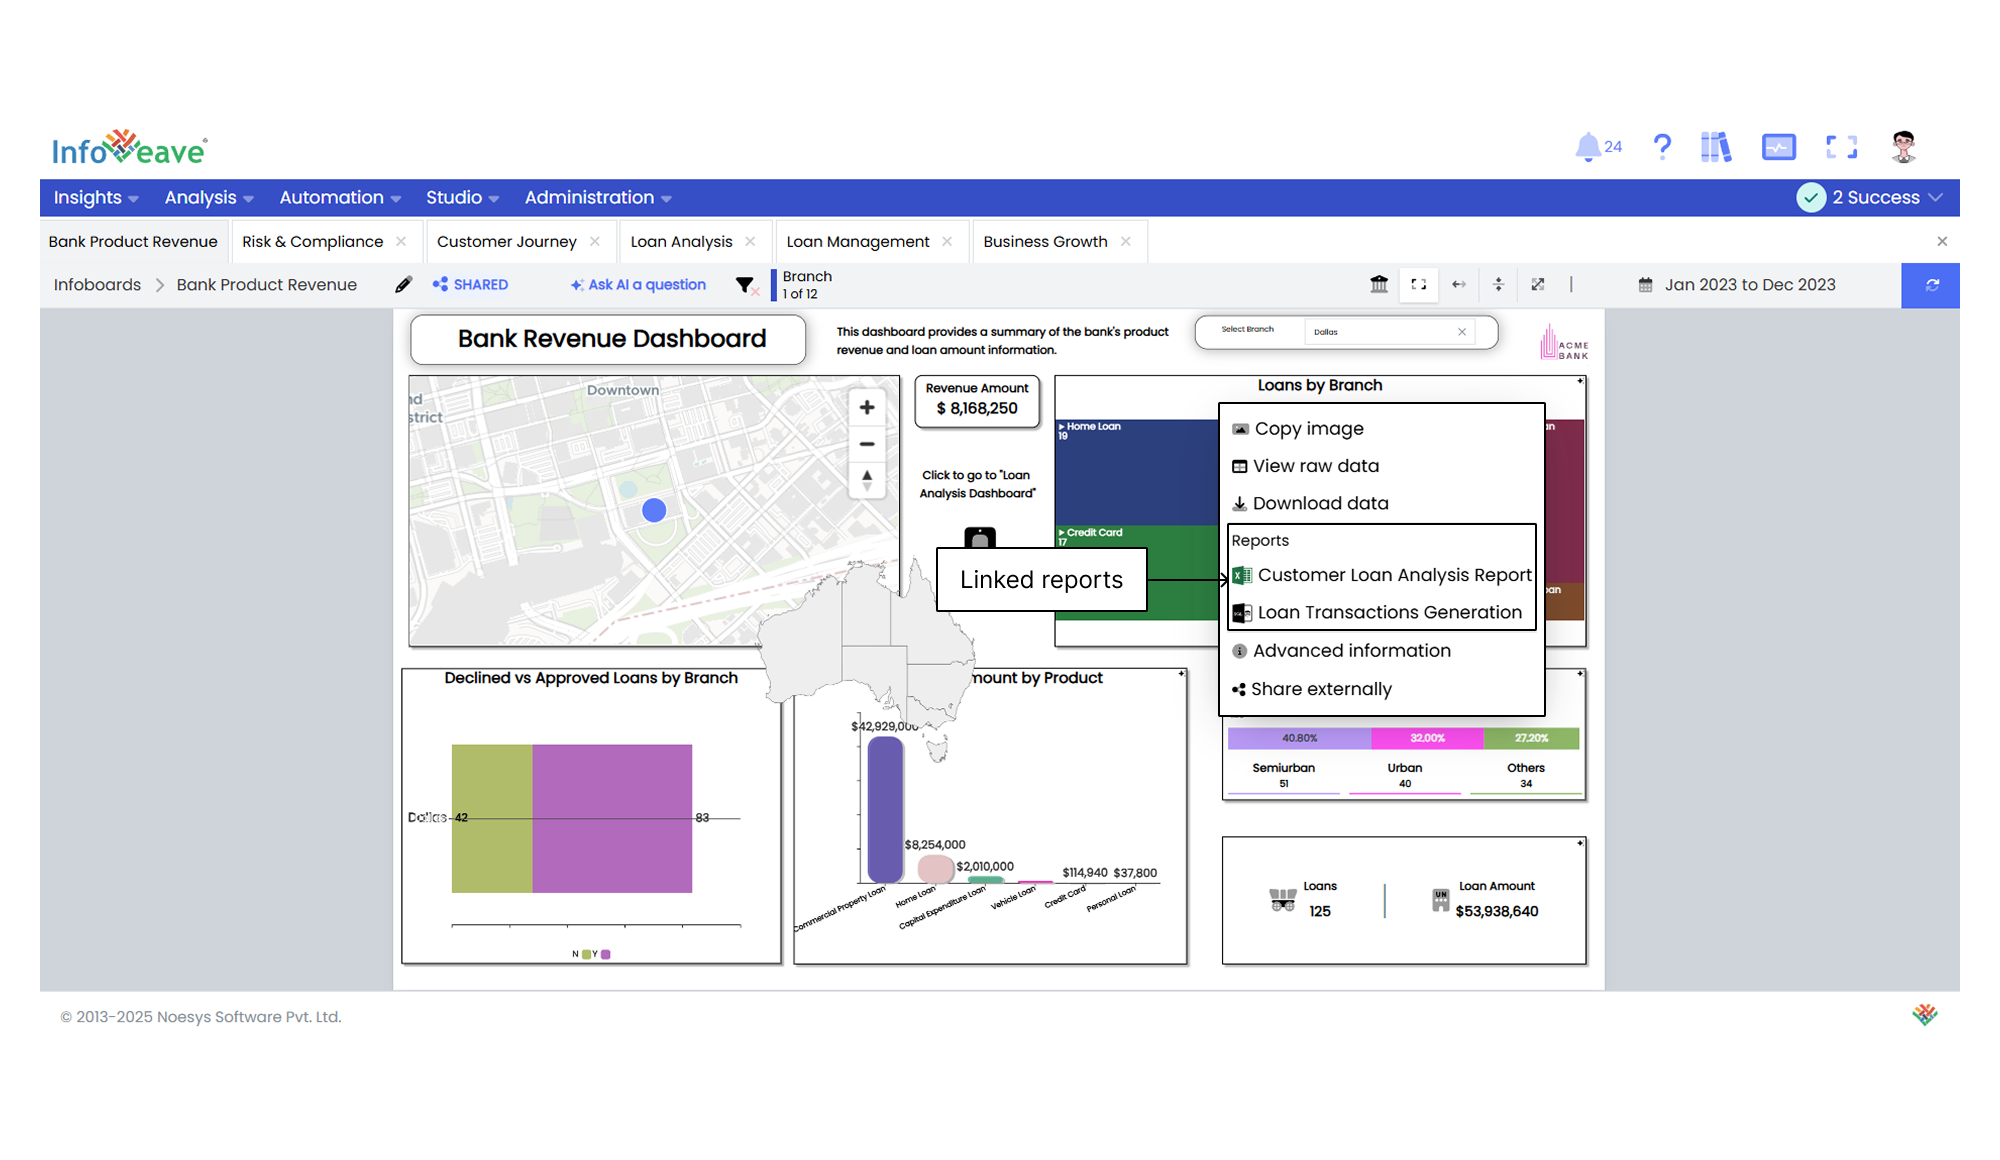
- Open the desired Infoboard.
- Right-click the widget to view linked reports.
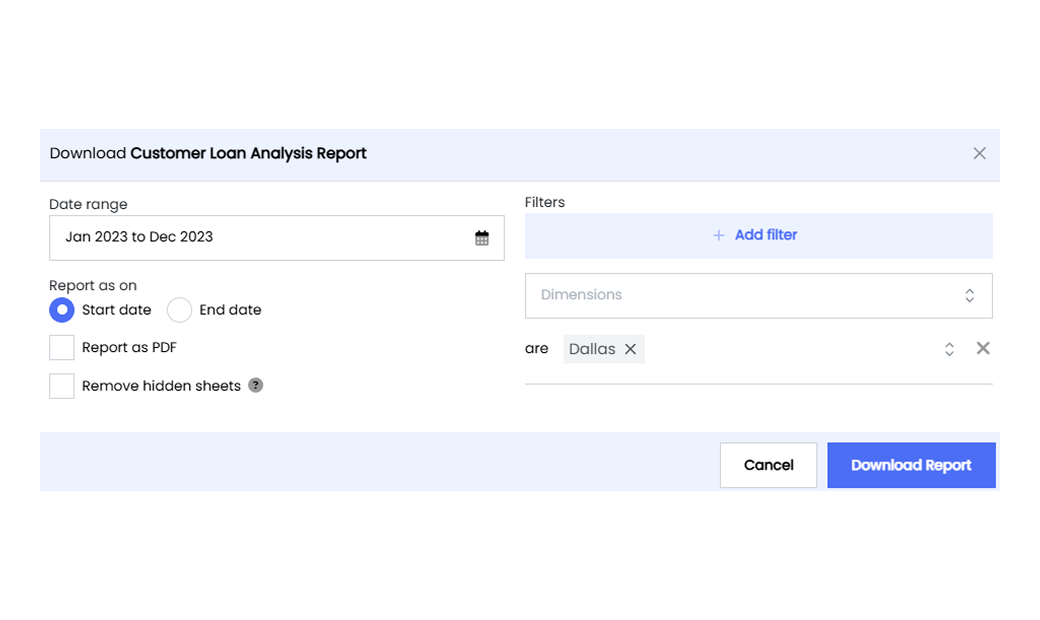
- Under the Reports section, select the report you want to download.
To learn more, visit Downloading Reports