Decomposition Tree
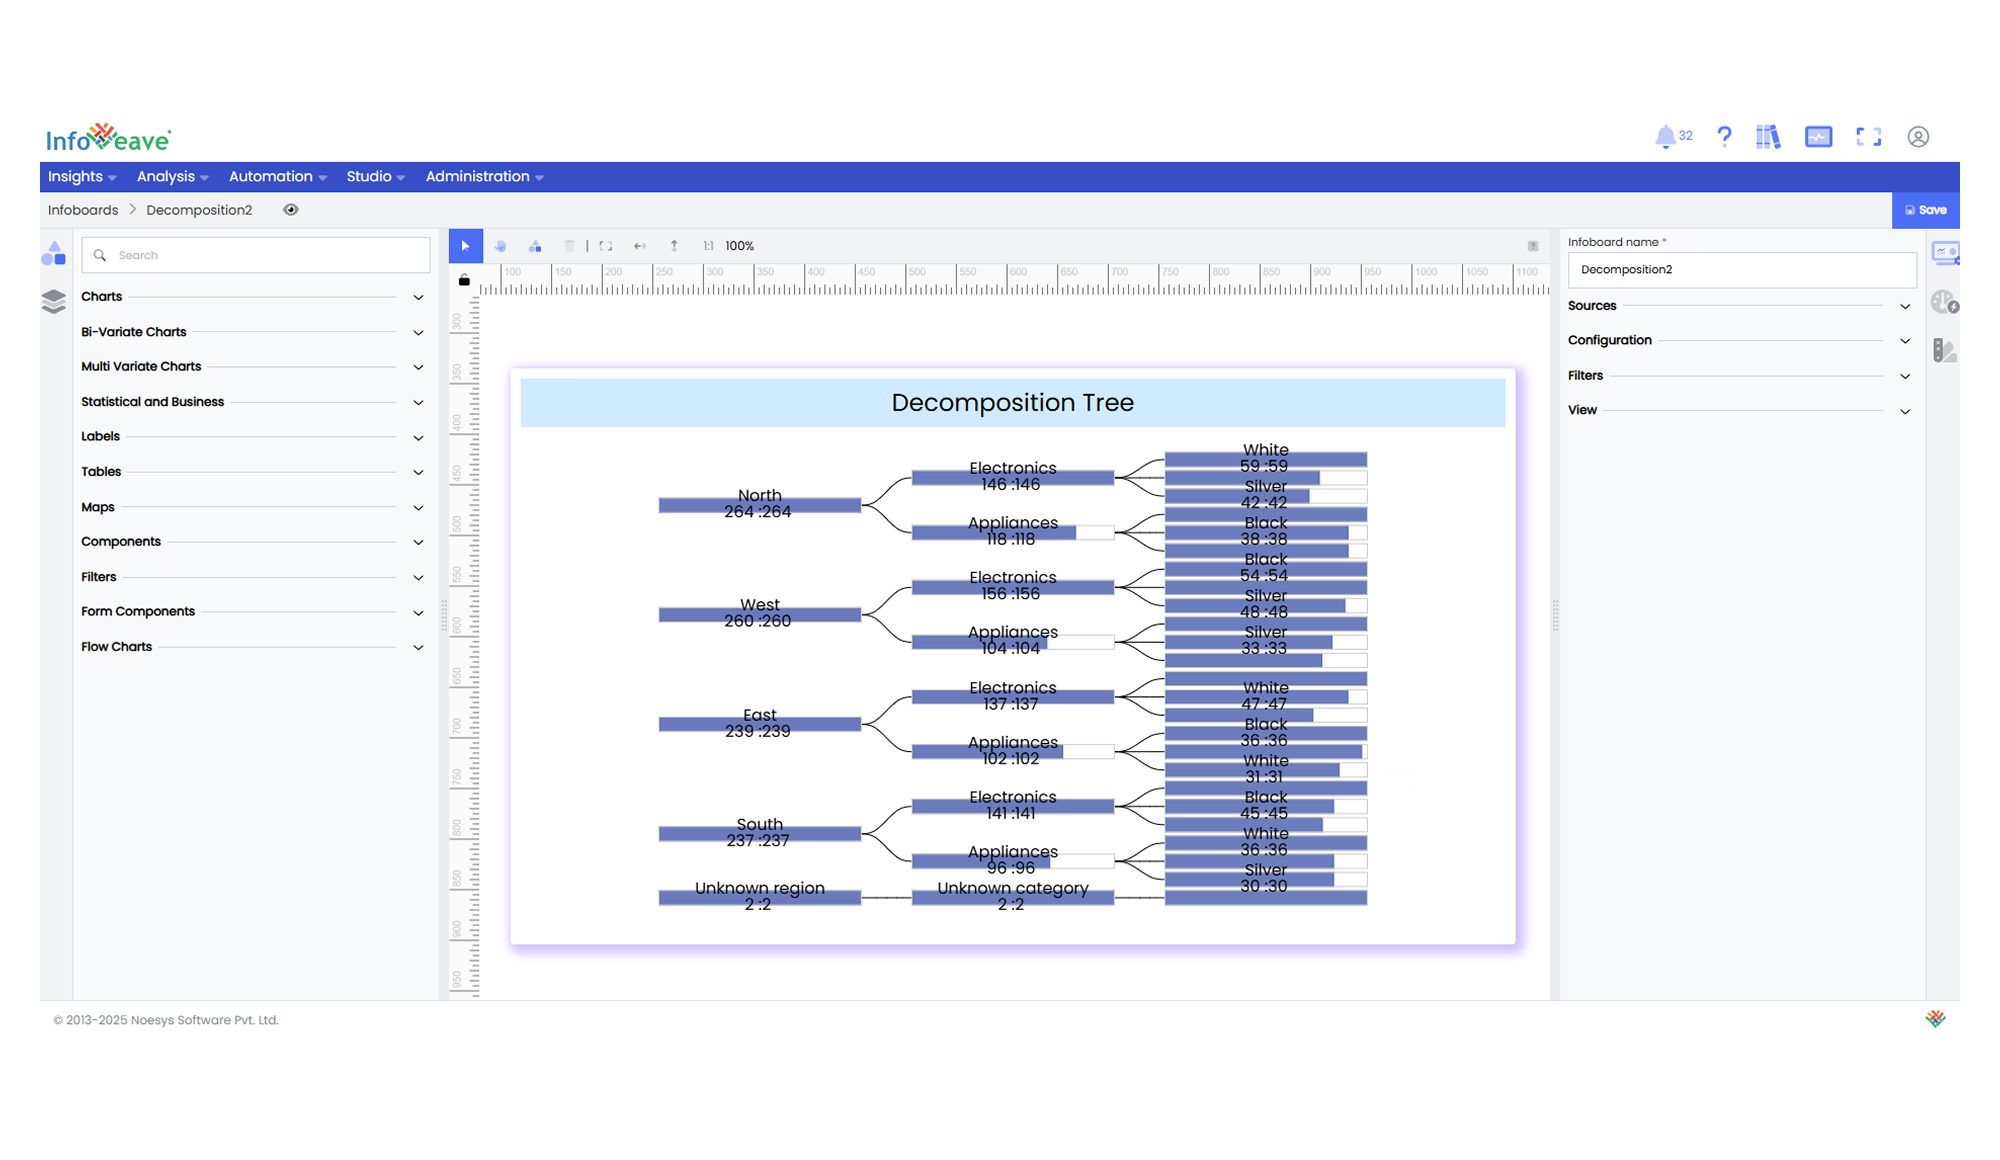
The Decomposition Tree Chart displays quantitative values distributed across nested hierarchical levels. Each node is rendered as a horizontal bar whose length represents its numeric measure, while smooth Bézier curves connect parent and child nodes to emphasise structural relationships.
Unlike radial or collapsible trees that focus primarily on topology, Decomposition Trees highlight value magnitude at every level, enabling rapid comparison of sibling nodes and the cumulative contribution of each branch.
Use cases:
- Organisational structures showing team sizes by division, department, and squad
- Geographic breakdowns such as Country → State → City populations
- Product category hierarchies with sales volumes across multiple levels
- Any multi‑tier taxonomy requiring side‑by‑side value comparison
⚙️ Setup
- Drag the Decomposition Tree Chart widget from the chart library onto your designer workspace.
- Select the chart.
- Go to the Widget Configuration tab in the Customize panel.
- Under the Configuration tab, select the Basic Configuration option to access the essential settings for the decomposition tree chart.
- Select the Source which the chart will pull data from.
- Map:
- Measure (Value) — Numeric field sizing each node’s bar.
- Dimension Labels — One or more categorical fields (up to 10) that define hierarchy levels.
📊 Basic Configuration
| Configuration Item | Description |
|---|---|
| Source | Data source containing hierarchical records. |
| Measure (Value) | Numeric field that determines bar length for each node. |
| Dimension Labels | One or more categorical fields defining hierarchy levels. |
| Date Field (optional) | Date dimension for time-series snapshots. |
🎨 Chart Customizations
| Category | Options & Description |
|---|---|
| General | Configure theme, background colour, borders, and drill-down behaviour. |
| Title | Enable and customise chart title text, alignment, font, and colour. |
| Series | Customise node colours, enable per‑level colour, control label display, orientation, and positioning. |
| Tooltip | Control tooltip content, formatting, and visibility on hover. |
| Others | Layout parameters such as Max Bar Width/Height, Column Gap, and Link Style (colour, width, dash type, shadow, opacity). |
📊 Example Visualization