Funnel
The Funnel Chart is ideal for displaying data that flows through sequential stages in a process.
It’s particularly useful for highlighting drop-off points between steps in a pipeline or illustrating conversion rates.
Use cases:
- Sales pipeline conversions
- User registration steps
- Lead qualification processes
- Drop-off analysis at each stage of an onboarding journey
⚙️ Setup
- Drag the Funnel Chart widget from the chart library onto your designer workspace.
- Select the chart.
- Go to the Widget Configuration tab in the Configuration panel.
- Under the Configuration panel tab, select the Basic Configuration option to access essential settings for the chart.
- Select the Source from which the chart will fetch its data.
- Map:
📊 Basic Configuration
| Configuration Item | Description |
|---|---|
| Source | The data source to query for chart values. |
| Measure | Numeric value for each step in the funnel. |
| Dimension | The sequential stages of the funnel process. |
🎨 Chart Customizations
| Category | Options & Description |
|---|---|
| General | Theme, background, animations, and accessibility options. |
| Title | Chart title, font, alignment, and visibility settings. |
| Sorting | Set funnel sorting order: ascending or descending. |
| Legend | Control legend visibility and position for the steps. |
| Series | Label visibility, position, overlap handling, colors (solid/gradient), and shadow styling. |
| Tooltip | Configure tooltip content, formatting, and triggers. |
| Others | Funnel-specific settings: gap size, top/bottom margin, width percentage, horizontal position, and value scaling method (Data, Total Sum, Custom). |
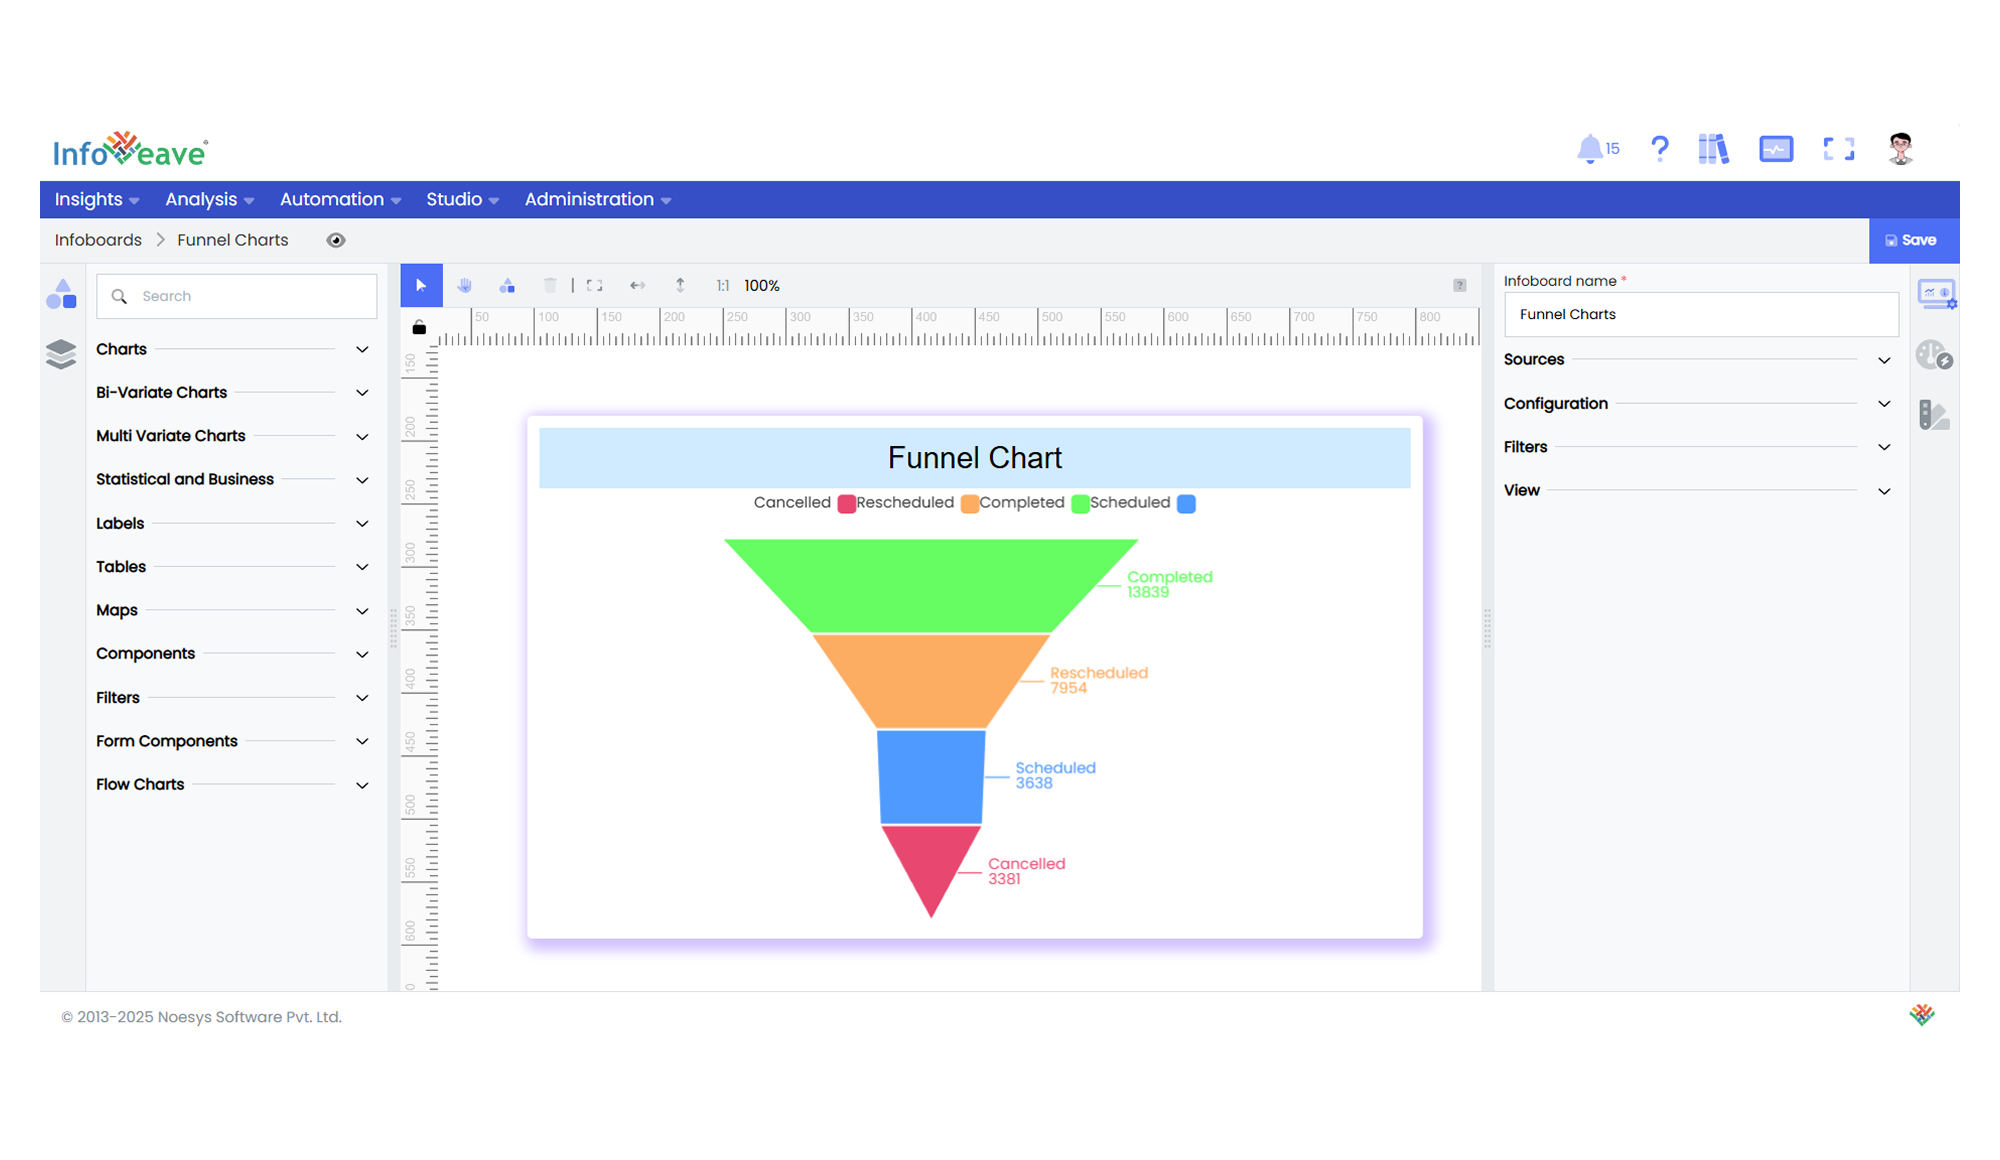
📊 Example Visualization