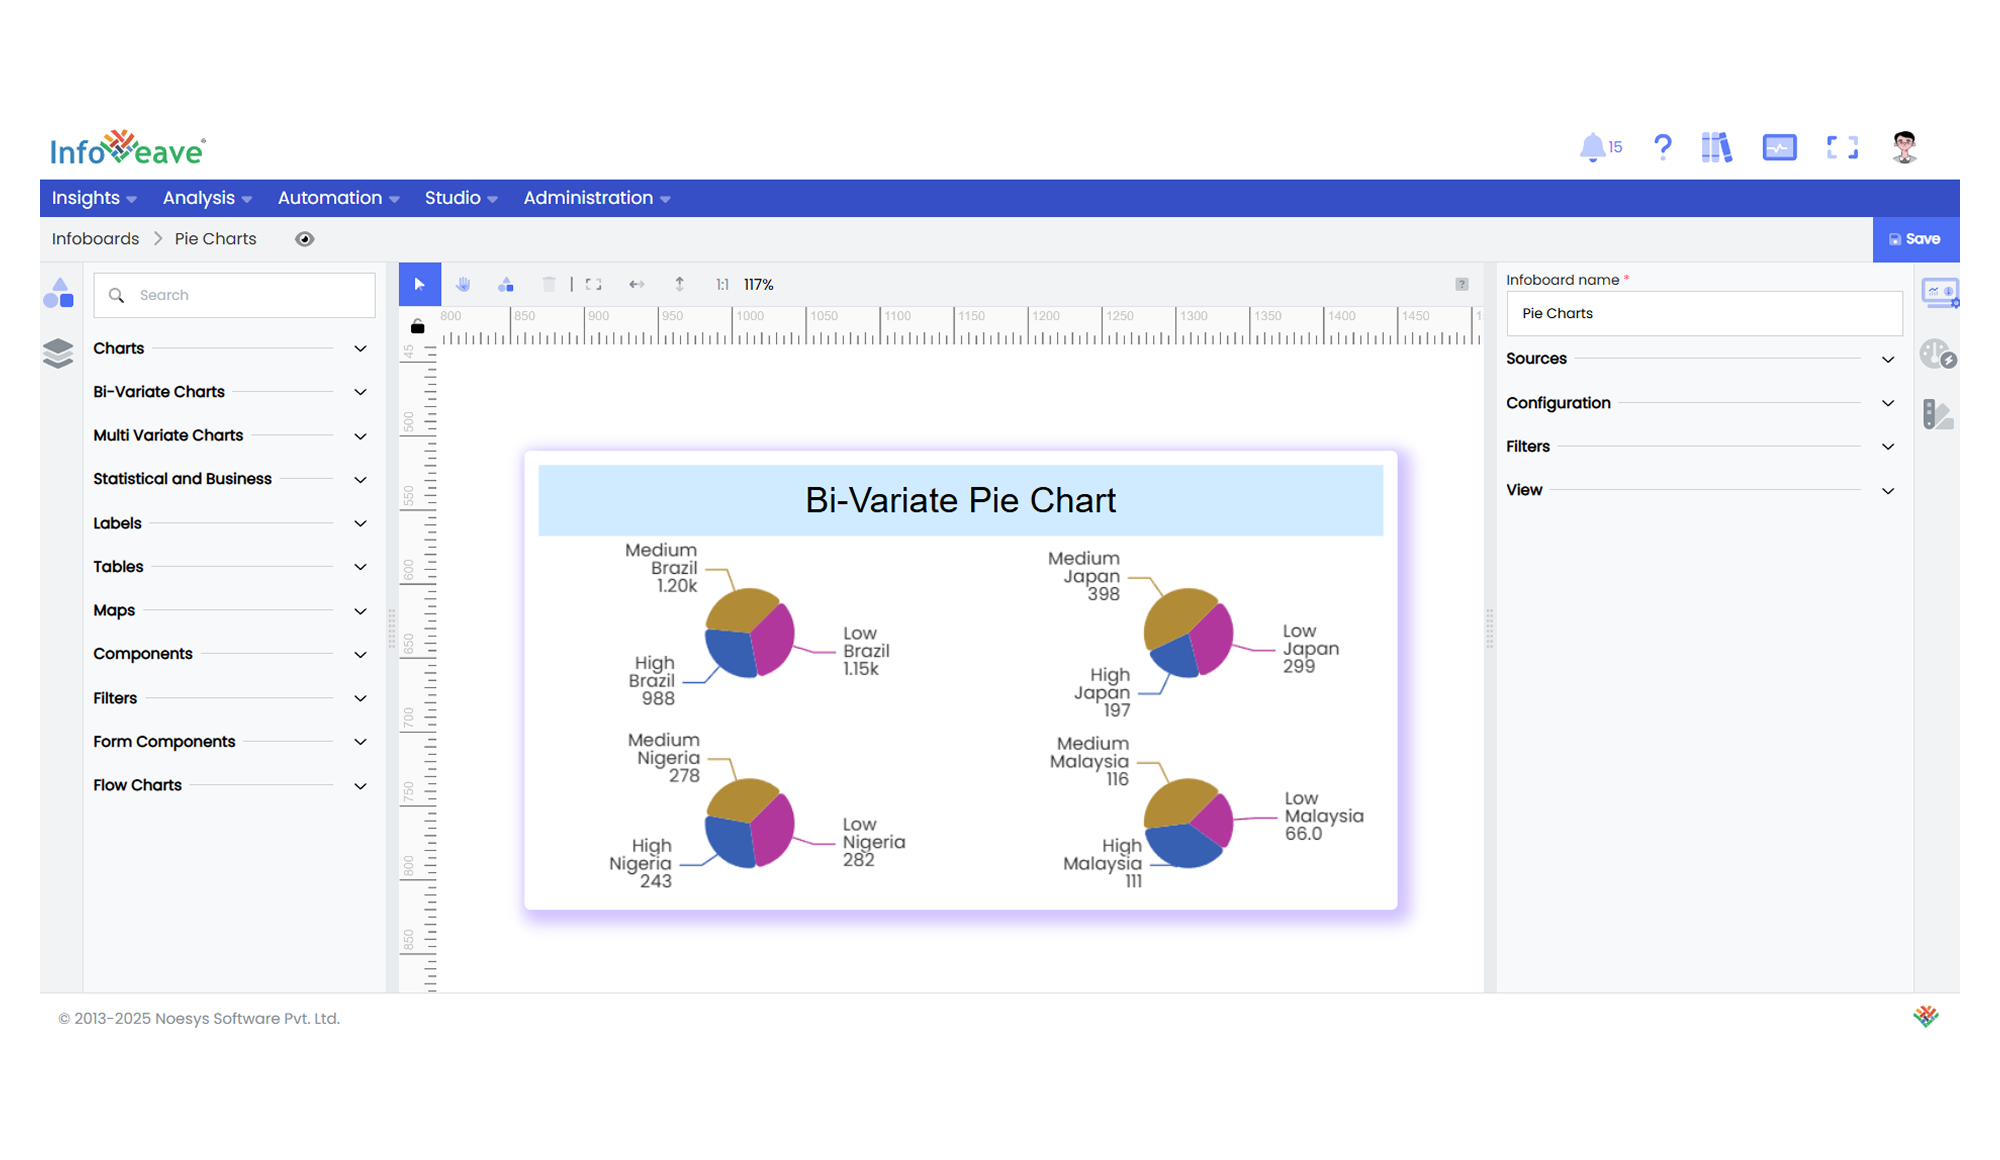
Bi-Variate Pie
The BiVariate Pie Chart visualizes category-wise distribution as pie slices, split across multiple grids based on a chosen dimension. It supports flexible label positioning, rose charts, border radii, and custom coloring per category.
Key Features:
- Multi-grid pie charts using Split dimension.
- Optional rose chart variations (
None,Radius,Area). - Per-category custom colors or palette-based coloring.
- Adjustable label position, orientation, and content.
- Configurable inner and outer radius for donut effects.
- Optional start angle rotation and clockwise settings.
- Grid layout with configurable rows, columns, and gaps.
- Rich tooltips and accessible ARIA support.
Use Cases:
- Comparing category-wise breakdowns across multiple regions, periods, or product types.
- Visualizing proportional data with advanced label and color controls.
- Building rose charts for cyclic or directional data insights.
- Pie charts with multi-panel layout for segmented analysis.
⚙️ Setup
- Add a BiVariate Pie Chart widget from the chart library onto your designer workspace.
- Select the chart.
- Go to the Widget Configuration tab in the Customize panel.
- Under the Configuration tab, select the Basic Configuration option to access the essential settings for the bi variate pie chart.
- Select the Source which the chart will pull the data from the option.
- Map:
- Optionally add a Date field for time-based filtering.
- Enable Hide Zero Values to omit symbols with zero values if needed.
📊 Basic Configuration
| Configuration Item | Description |
|---|---|
| Source | Source providing the data for measures and dimensions. |
| Measure | Numeric measure representing slice size. |
| Dimension | Categorical field for pie slices. |
| Split | Field to split pie charts across panels. |
🎨 Chart Customizations
| Category | Options & Description |
|---|---|
| General | Modify the chart’s general appearance, including the background color, borders, shadows, and drill-out choices. |
| Title | Enable and customize chart title text, alignment, font, and color. |
| Sorting | Define custom sort orders for categories along the X and Y axes. |
| Position | Overall horizontal and vertical offset for chart layout. |
| Grid | Adjust chart margins, grid spacing, and padding around the matrix area. |
| Legend | Toggle visibility, position, orientation, and customize legend labels and icons. |
| Series | Label visibility, position, overlap handling, orientation, custom colors, and shadow effects. |
| Tooltip | Rich hover info for slices. |
| [Others] | Clockwise setting, radius adjustments, border radius, rotation, and rose chart type. |
📊 Example Visualization