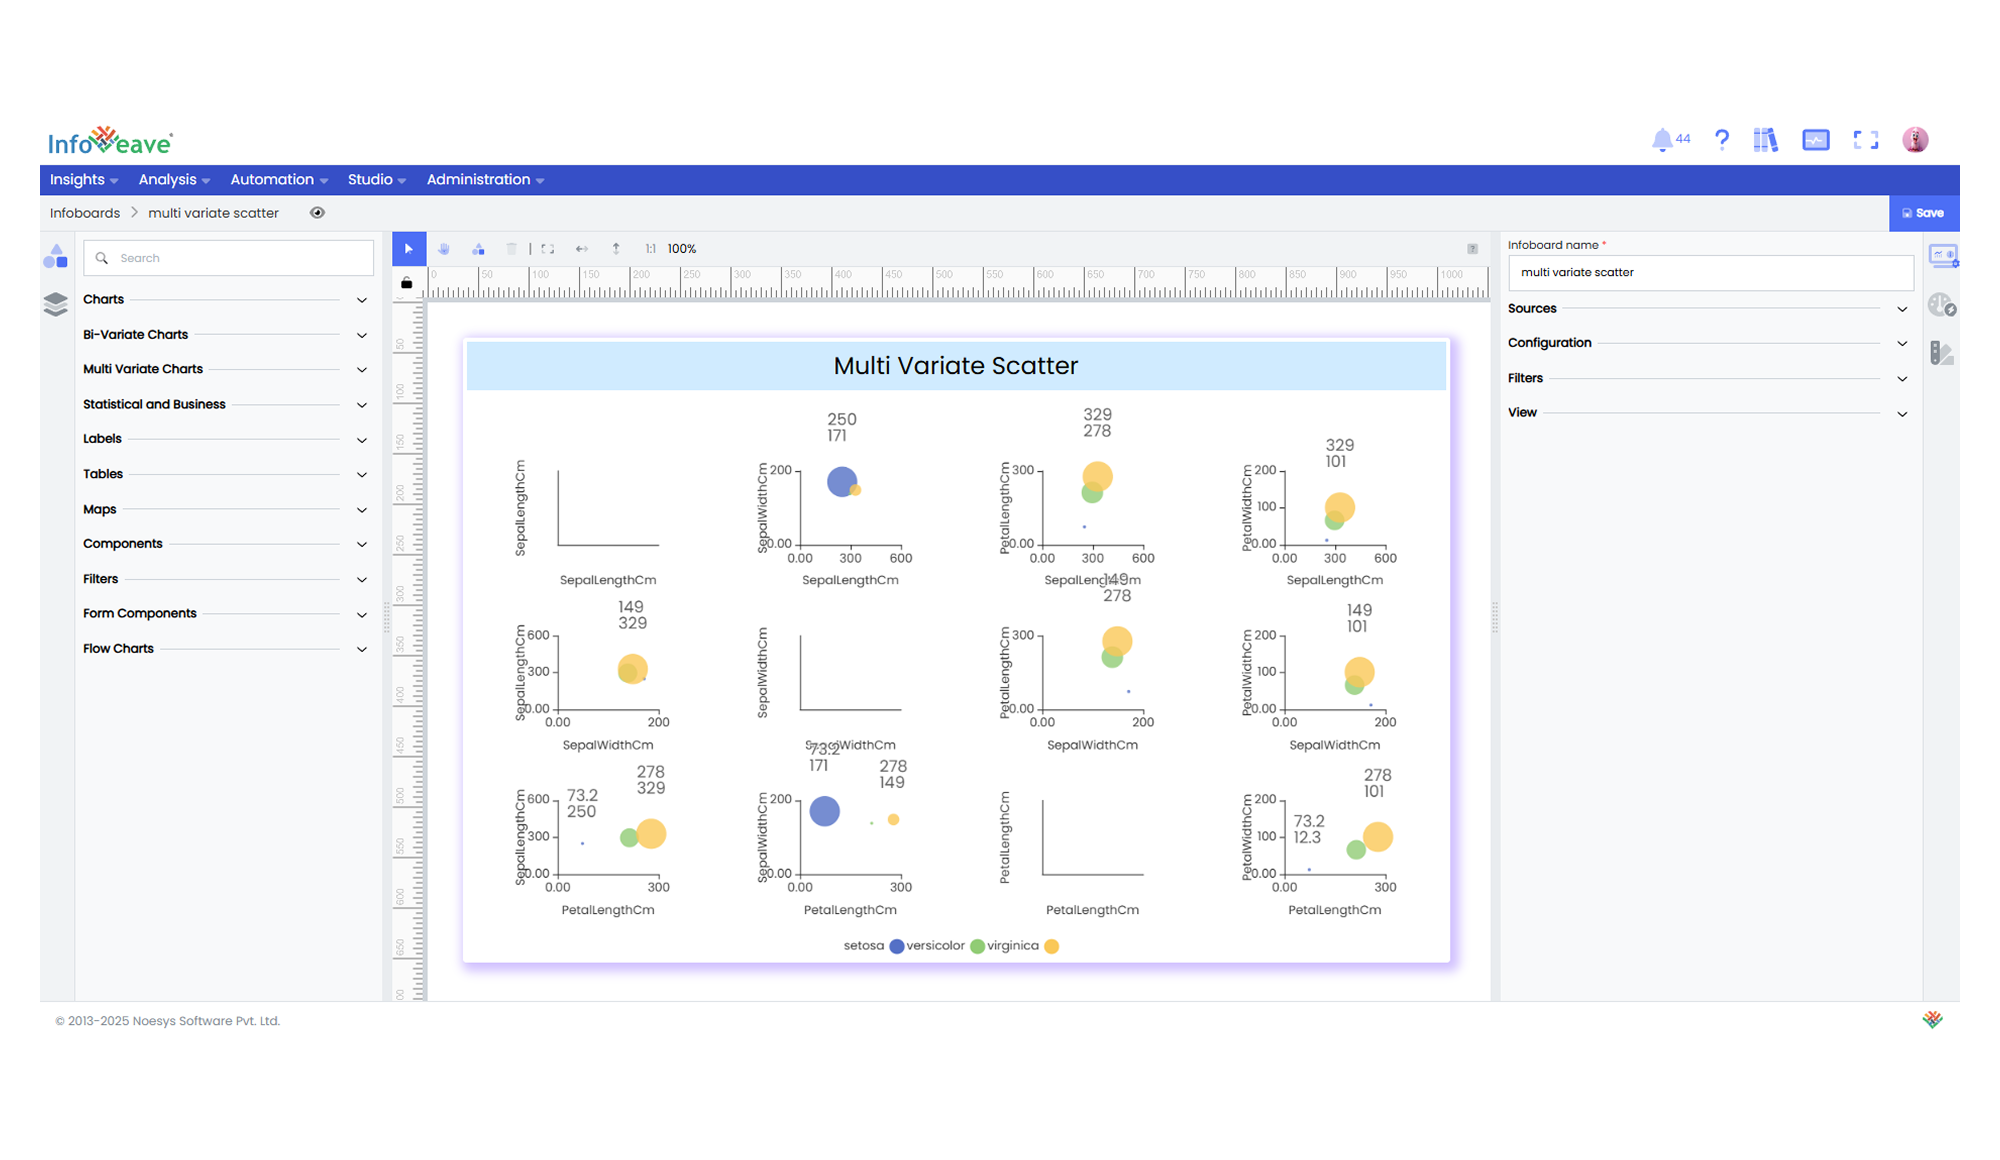
Multi Variate Scatter
The MultiVariate Scatter Chart enables multi-panel scatter plots for visualizing relationships between pairs of numeric measures within a grid layout. Each grid plots one numeric measure against another, optionally scaling each point by a third variable.
Key Features:
- Supports 2 to 6 numeric measures per scatter plot.
- Configurable symbol sizing based on a measure, X axis, or Y axis.
- Customizable multi-grid layout: specify rows, columns, and margins.
- Optional grouping dimension for series-wise point coloring.
- Configurable box shadow effects per point for depth.
- Interactive tooltip and legend settings.
- Drilldown interactions available on points.
Use Cases:
- Comparing correlations across different numeric variable pairs.
- Visualizing relationships and clusters in multi-dimensional numeric data.
- Multi-panel exploratory analysis of measure interactions.
⚙️ Setup
- Add a MultiVariate Scatter Chart widget from the chart library onto your designer workspace.
- Select the chart.
- Go to the Widget Configuration tab in the Customize panel.
- Under the Configuration tab, select the Basic Configuration option to access the essential settings for the multi variate scatter chart.
- Map:
- Optionally add a Date field for time-based filtering.
- Enable Hide Zero Values to omit symbols with zero values if needed.
📊 Basic Configuration
| Configuration Item | Description |
|---|---|
| Source | Source providing the data for measures and dimensions. |
| Measure | Numeric fields to plot on X and Y axes. |
| Size (optional) | Numeric measure for scaling point size. |
| Group | Dimension for color-coding point series. |
🎨 Chart Customizations
| Category | Options & Description |
|---|---|
| General | Modify the chart’s general appearance, including the background color, borders, shadows, and drill-out choices. |
| Title | Enable and customize chart title text, alignment, font, and color. |
| Sorting | Define custom sort orders for categories along the X and Y axes. |
| Grid | Adjust chart margins, grid spacing, and padding around the matrix area. |
| Legend | Toggle visibility, position, orientation, and customize legend labels and icons. |
| XAxis | Log/linear scaling, axis labels, and range settings. |
| YAxis | Log/linear scaling, axis labels, and range settings. |
| Series | Point colors, labels, styles, and border settings. |
| Tooltip | Control tooltip content, formatting, and visibility on hover. |
| [Others] | Symbol sizing rules, symbol min/max sizes, and box shadow styles. |
📊 Example Visualization