
Reports
In Infoveave, a report is a structured document that presents data and insights in a formatted manner. It provides a concise summary of data analysis. It often includes visualizations such as charts and tables. Reports in Infoveave help you communicate data-driven insights effectively. They support informed decision-making processes.
Using Infoveave, you can create Excel template reports or PowerPoint template reports. Template reports are pre-designed frameworks that you use to generate structured reports. They integrate with tools like PowerPoint or Excel. This allows you to create visually engaging documents that align with your organizational standards. By leveraging Infoveave’s powerful report generation features, you can automate reporting. You can refresh data dynamically. You can also schedule reports for regular updates. You can download reports for analysis and embed them into templates for documentation.
Infoveave also allows you to create SQL query reports for customised reporting and analysis.
Creating Reports
Easily create customized reports in Infoveave using SQL queries or MS Office templates. This enables smooth collaboration and helps you gain data-driven insights. Infoveave supports the following options for report generation.
- Template reports
- Query reports
Template Reports
Template Reports are pre-designed frameworks used to generate structured reports. They often integrate with tools like PowerPoint or Excel, allowing to create visually engaging documents that align with organizational standards. You can use the Infoveave Add-in for MS Office to simplify the process of creating template reports.
Installing the Infoveave Plugin
Enable the Infoveave Add-in in Microsoft Office tools like Word, PowerPoint or Excel. This allows you to connect directly with the Infoveave platform for seamless reporting.
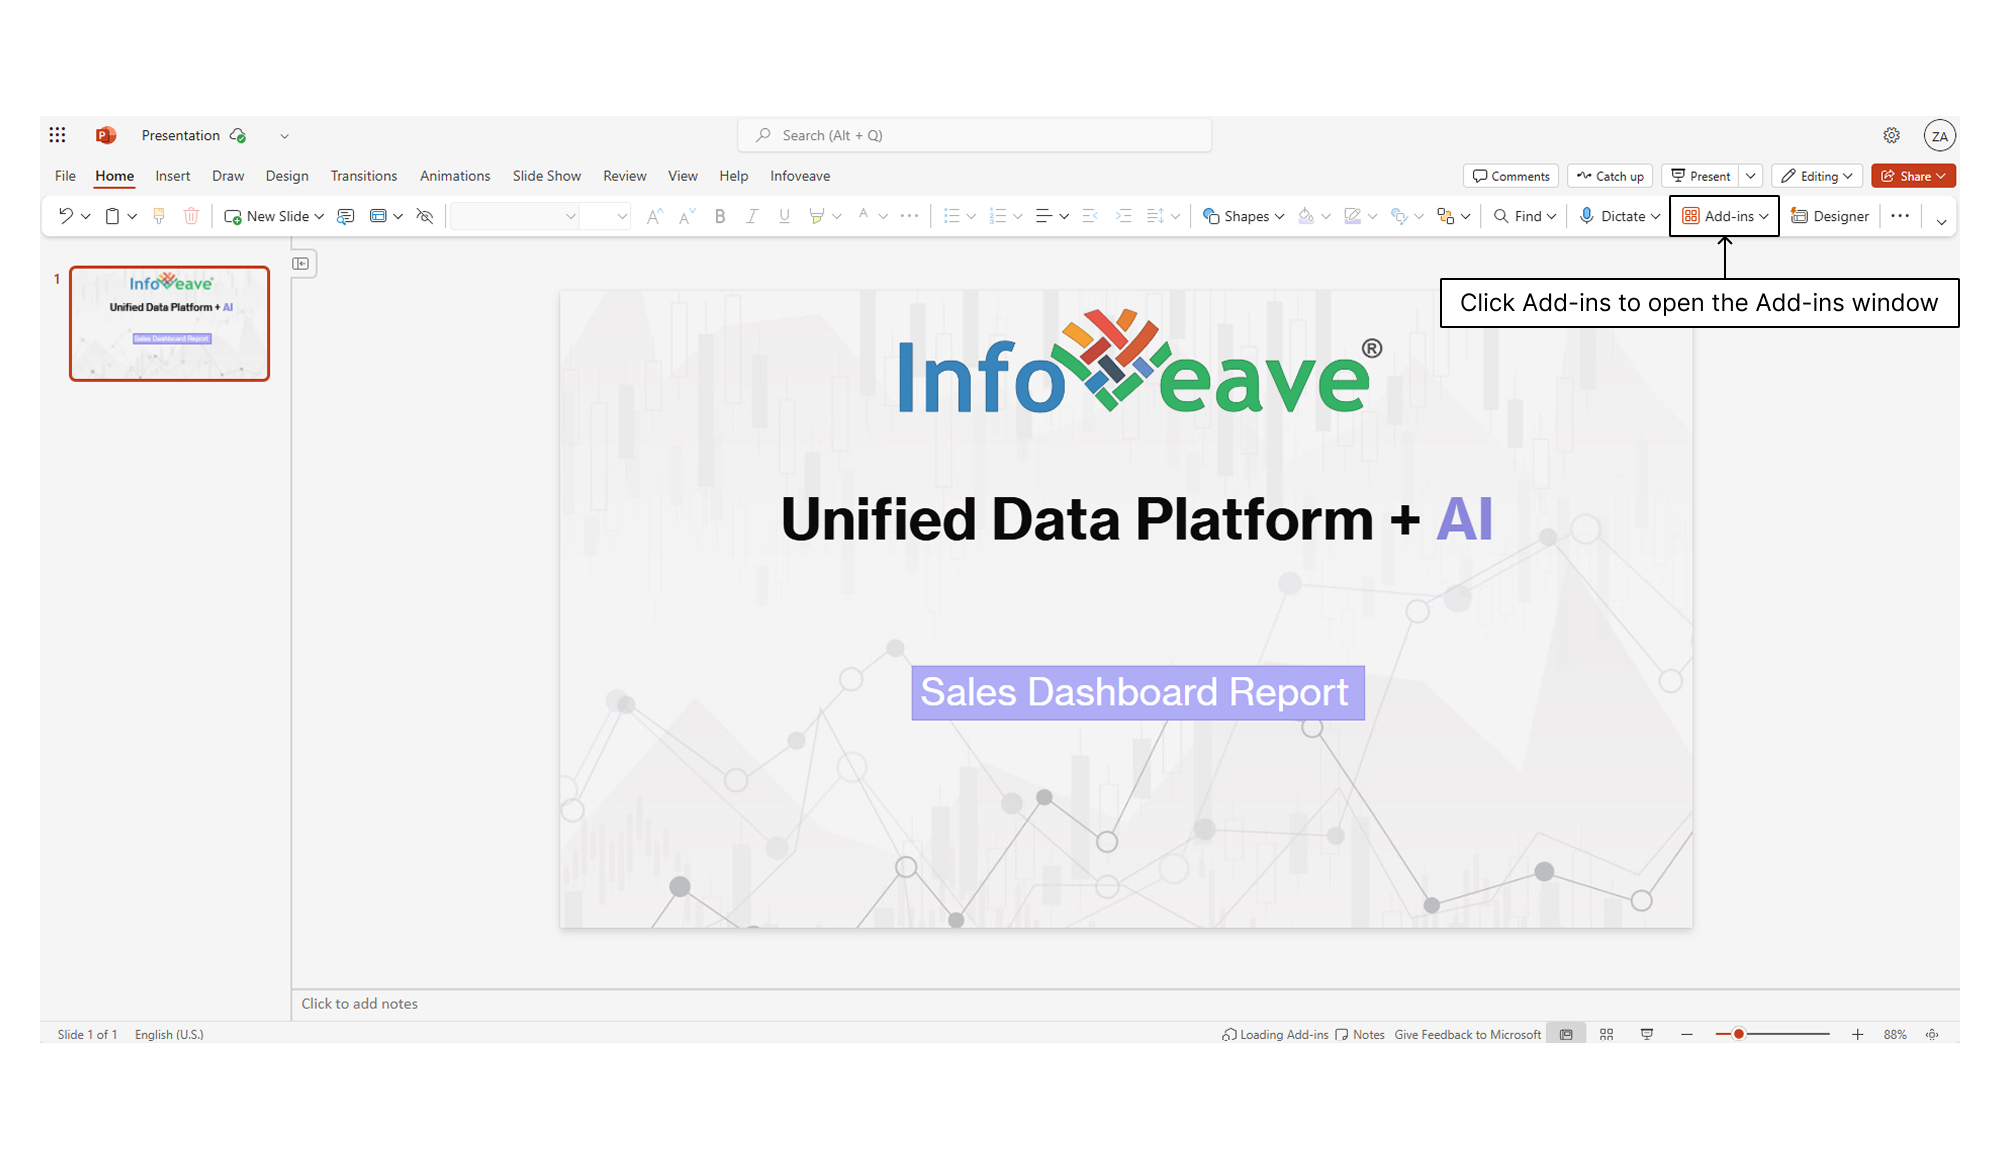
- To install the Infoveave plugin in your MS Office tools, open Microsoft Word, PowerPoint or Excel. Click Add-ins to open the Office Add-ins window.
- In the Store tab, type Infoveave and click Add to install the Infoveave Add-in.
- The Infoveave plugin is now available under the Insert option in your MS Office tool.
Connecting with Infoveave
Access the Infoveave plugin. Securely authenticate and connect with Infoveave to establish a secure connection between your MS Office tools and your Infoveave account.
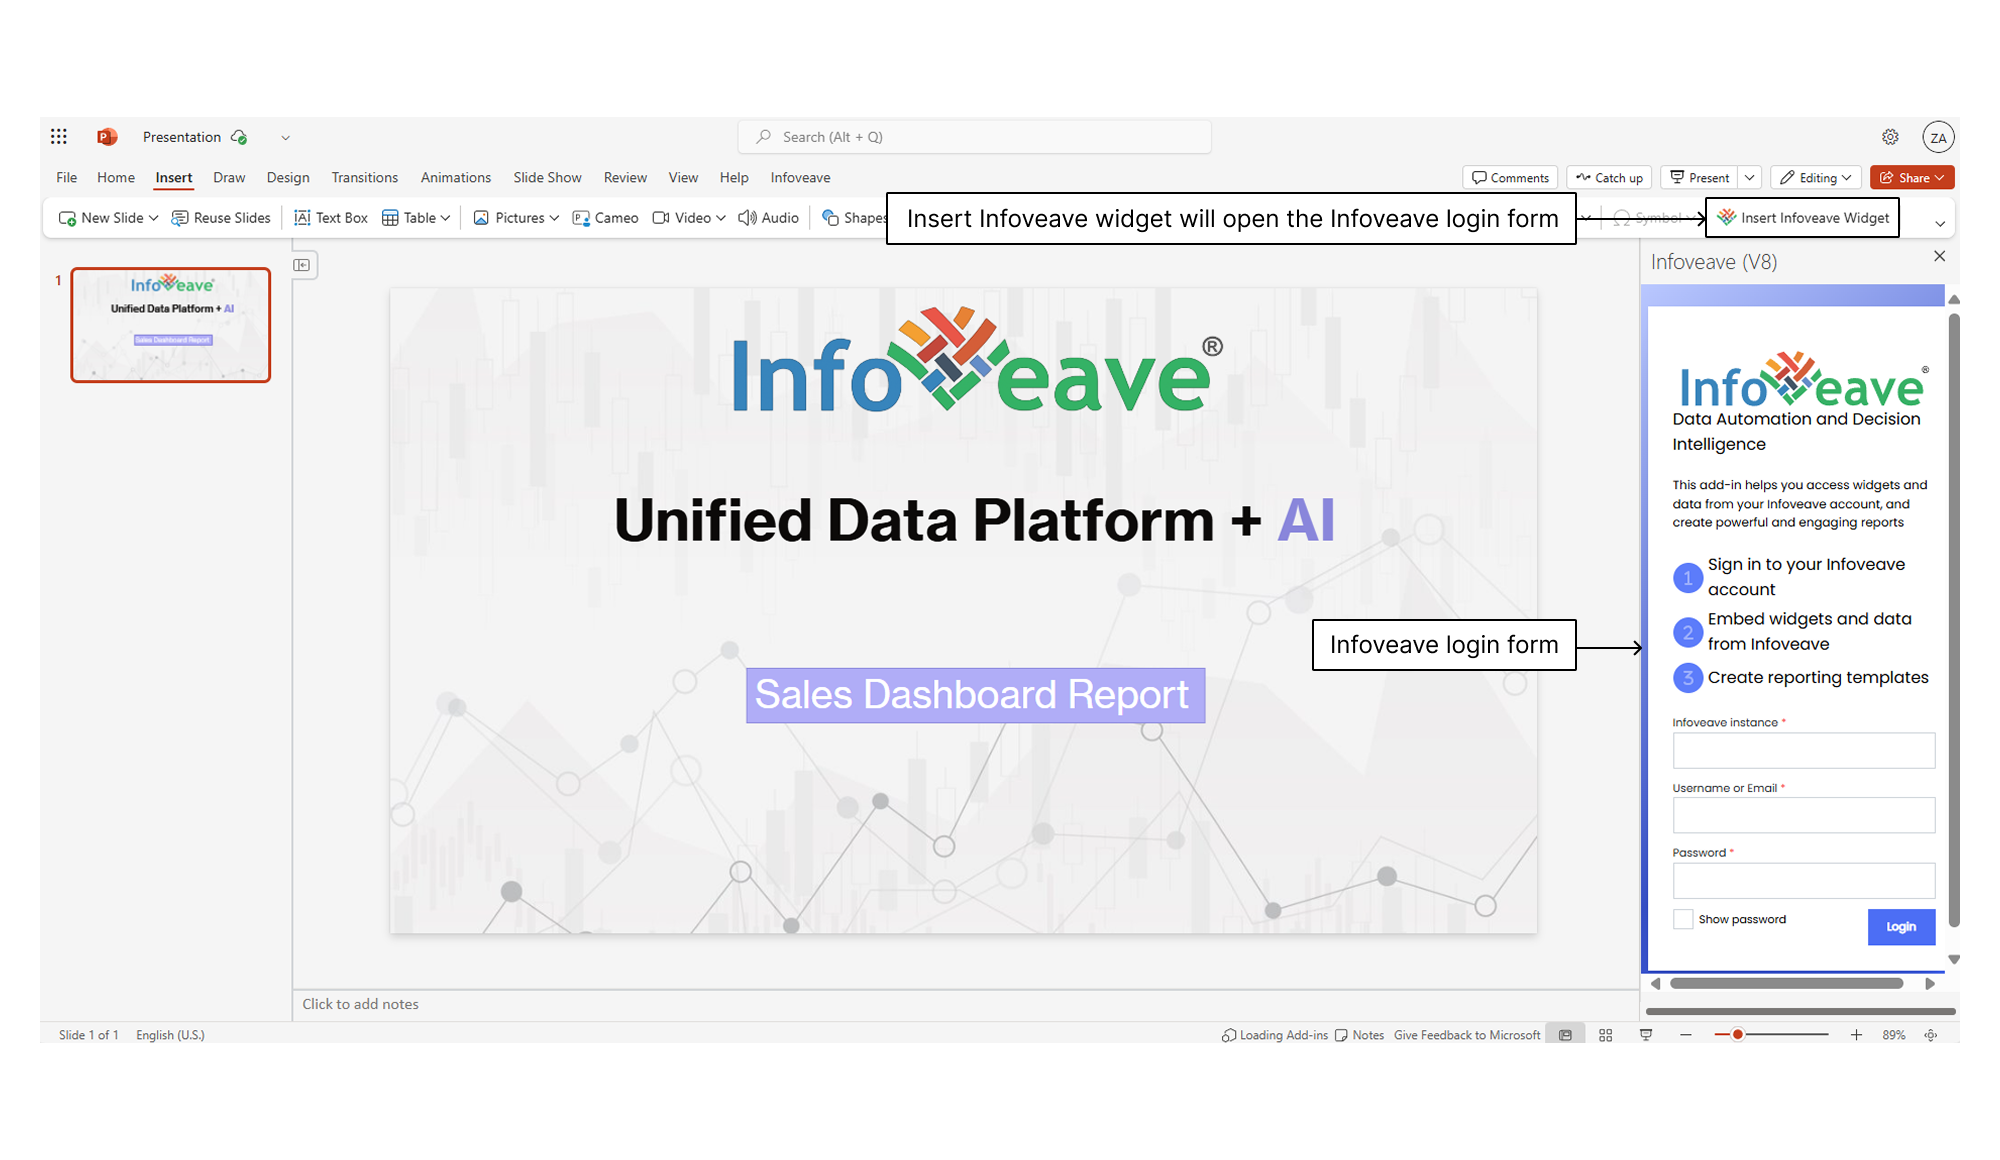
- Click on the installed Infoveave plugin under the Insert option in your MS Office tool. This action opens the Infoveave login form on the right side of the screen.
- In the Infoveave Instance field, enter your Infoveave instance. Your Infoveave instance will be “YourName.infoveave.net,” where “YourName” represents the client.
- Enter your Username or Email in the corresponding field.
- Enter your Password in the appropriate field.
- Click the Login button to log in to your Infoveave account.
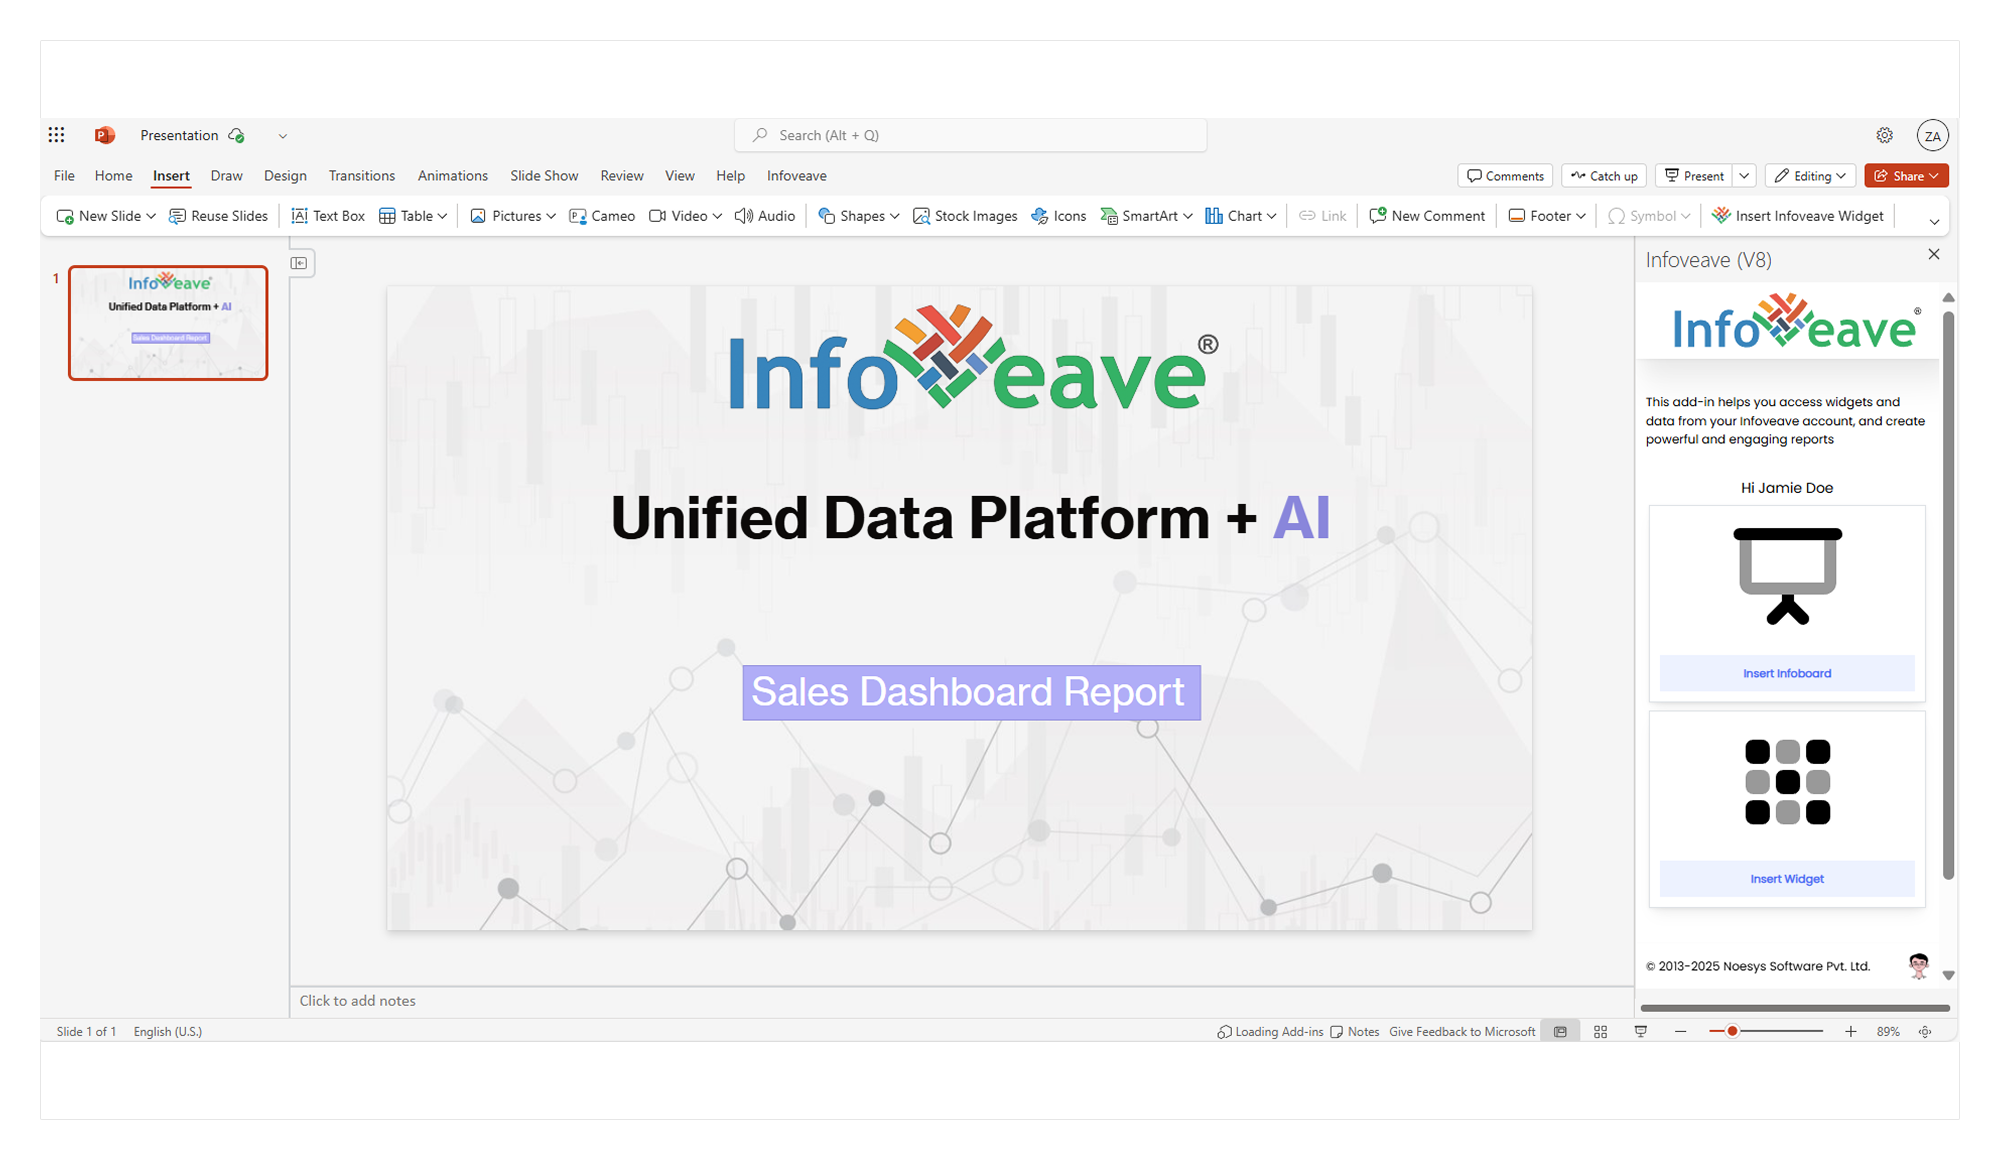
- After logging in, you will see the options Insert Infoboard, Insert Widget, and Insert Data. Choose the option that matches your requirement.
Inserting Infoboards and Widgets into Reports
Easily insert an entire Infoboard or individual widgets into your report. Choose from a list of available options. Customize based on dimensions and date ranges to enhance the visual appeal of your report with complete insights.
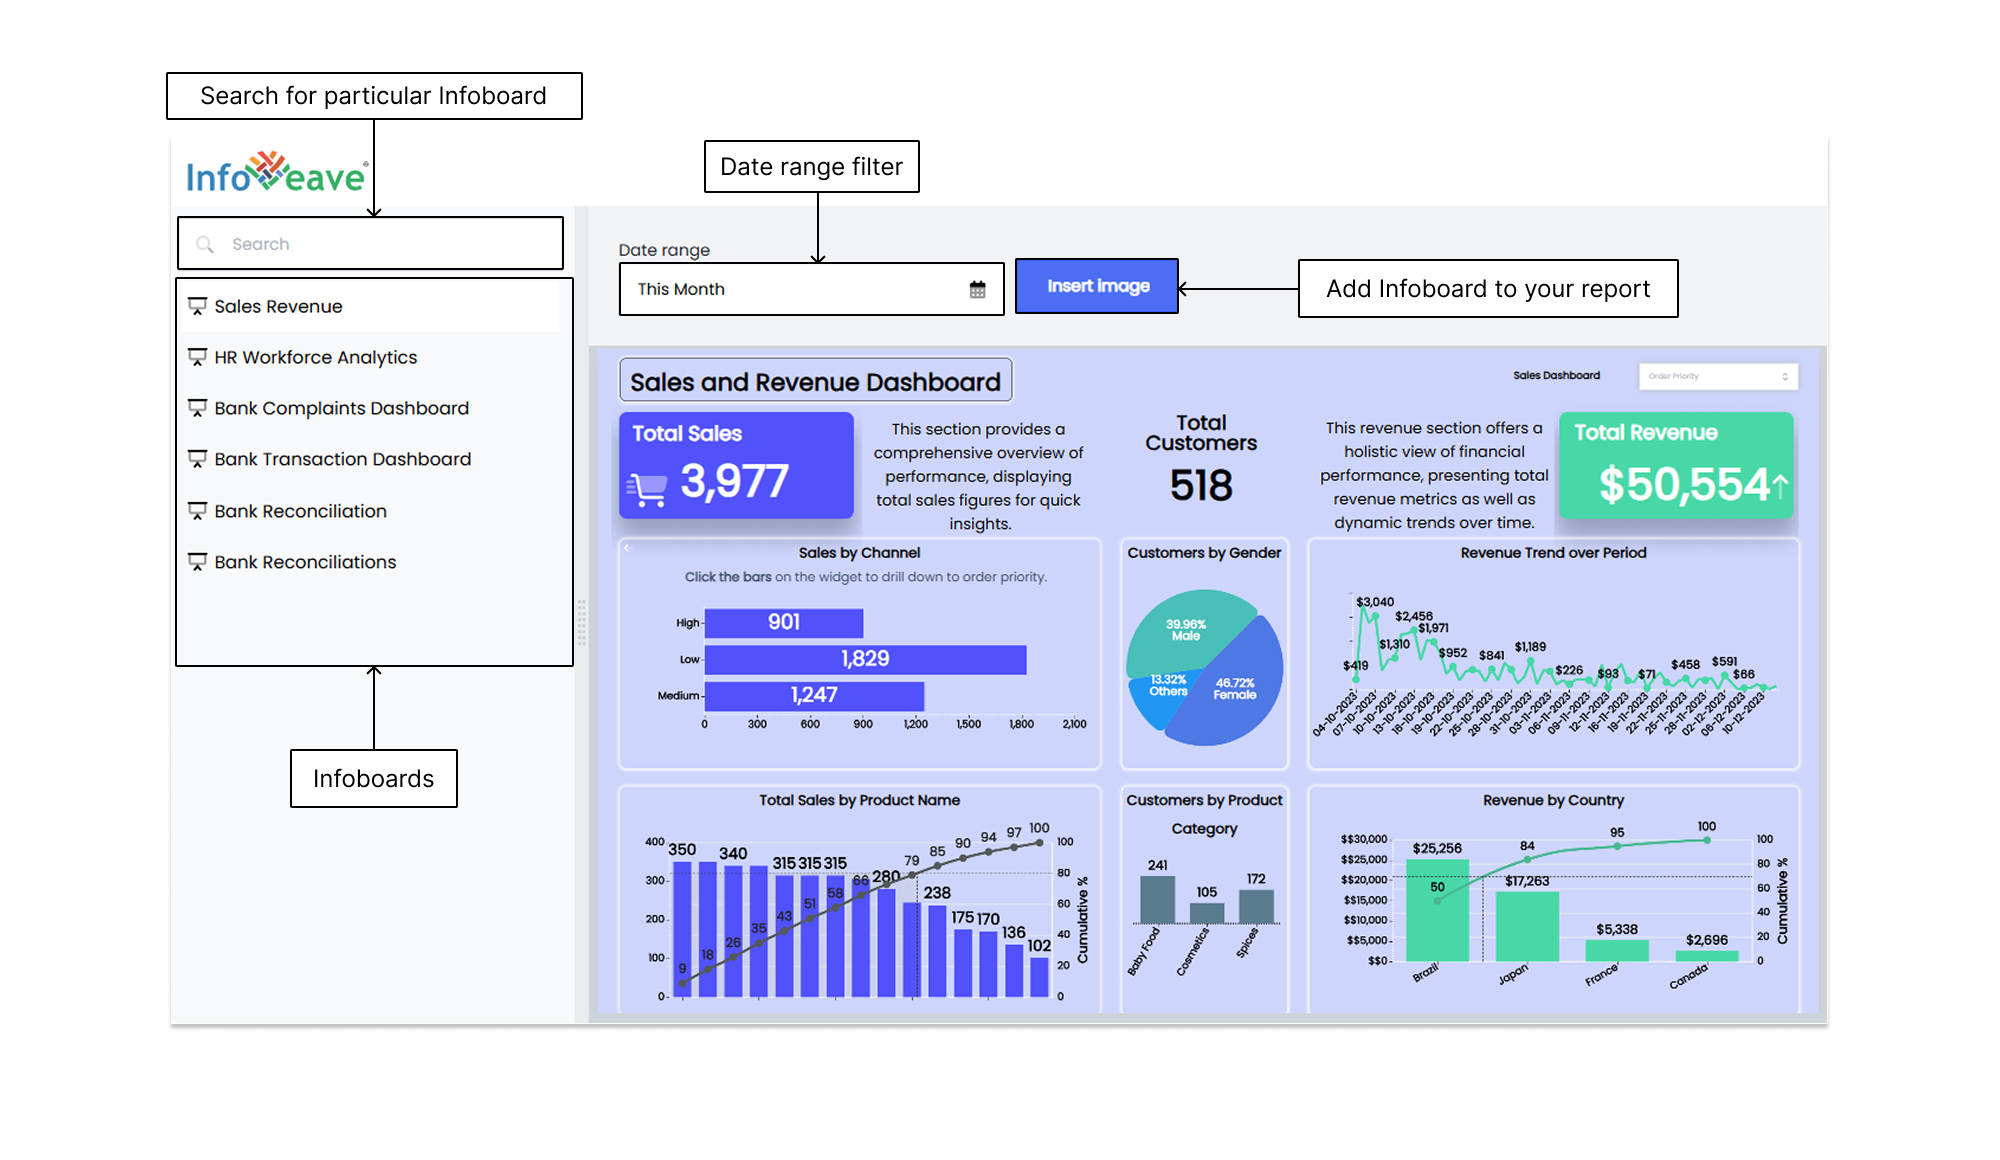
- To insert an Infoboard into your report, select the Insert Infoboard option.
- Use the search bar to find the Infoboard from the available list.
- After selecting the Infoboard, set dimensions and date range for preview.
- Select a specific Date Range for the Infoboard.
- The date range allows you to access the report relative to a specific date.
- Click the Insert Image button to add the Infoboard to your report.
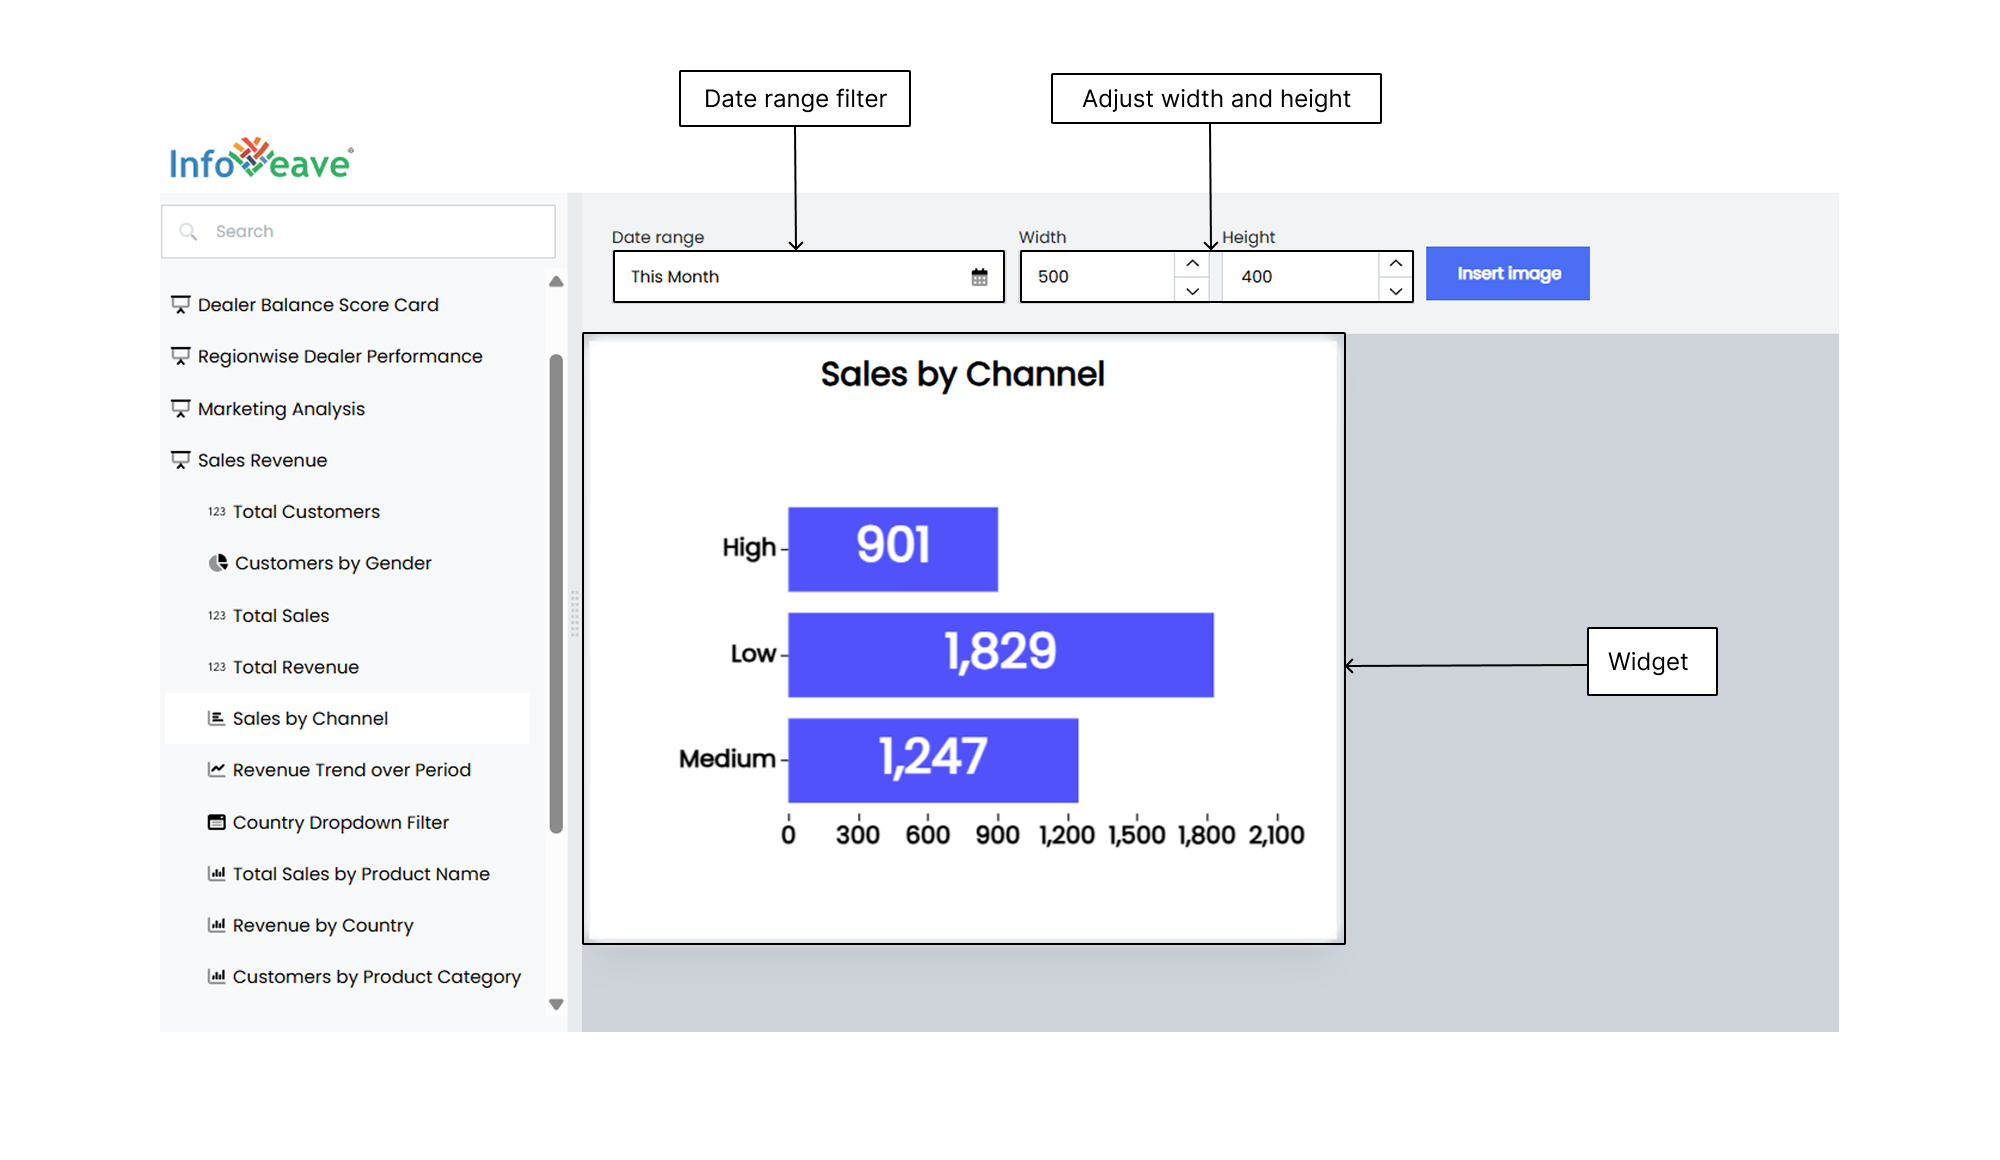
- To insert a widget into your report, select the Insert Widget option.
- Use the search bar to find the widget from the available list.
- After selecting the widget, set dimensions and date range for preview.
- Adjust the Width of the widget.
- Modify the Height of the widget.
- Select a specific Date Range for the widget.
- Click the Insert Image button to add the widget to your report.
- Save your detailed report with a report name for easy identification.
Inserting Data Reports
Easily create data reports in Microsoft Excel to link with an Infoboard or to share with your team. Customize the data report templates to match your theme and improve the visual appeal of your report with complete insights.
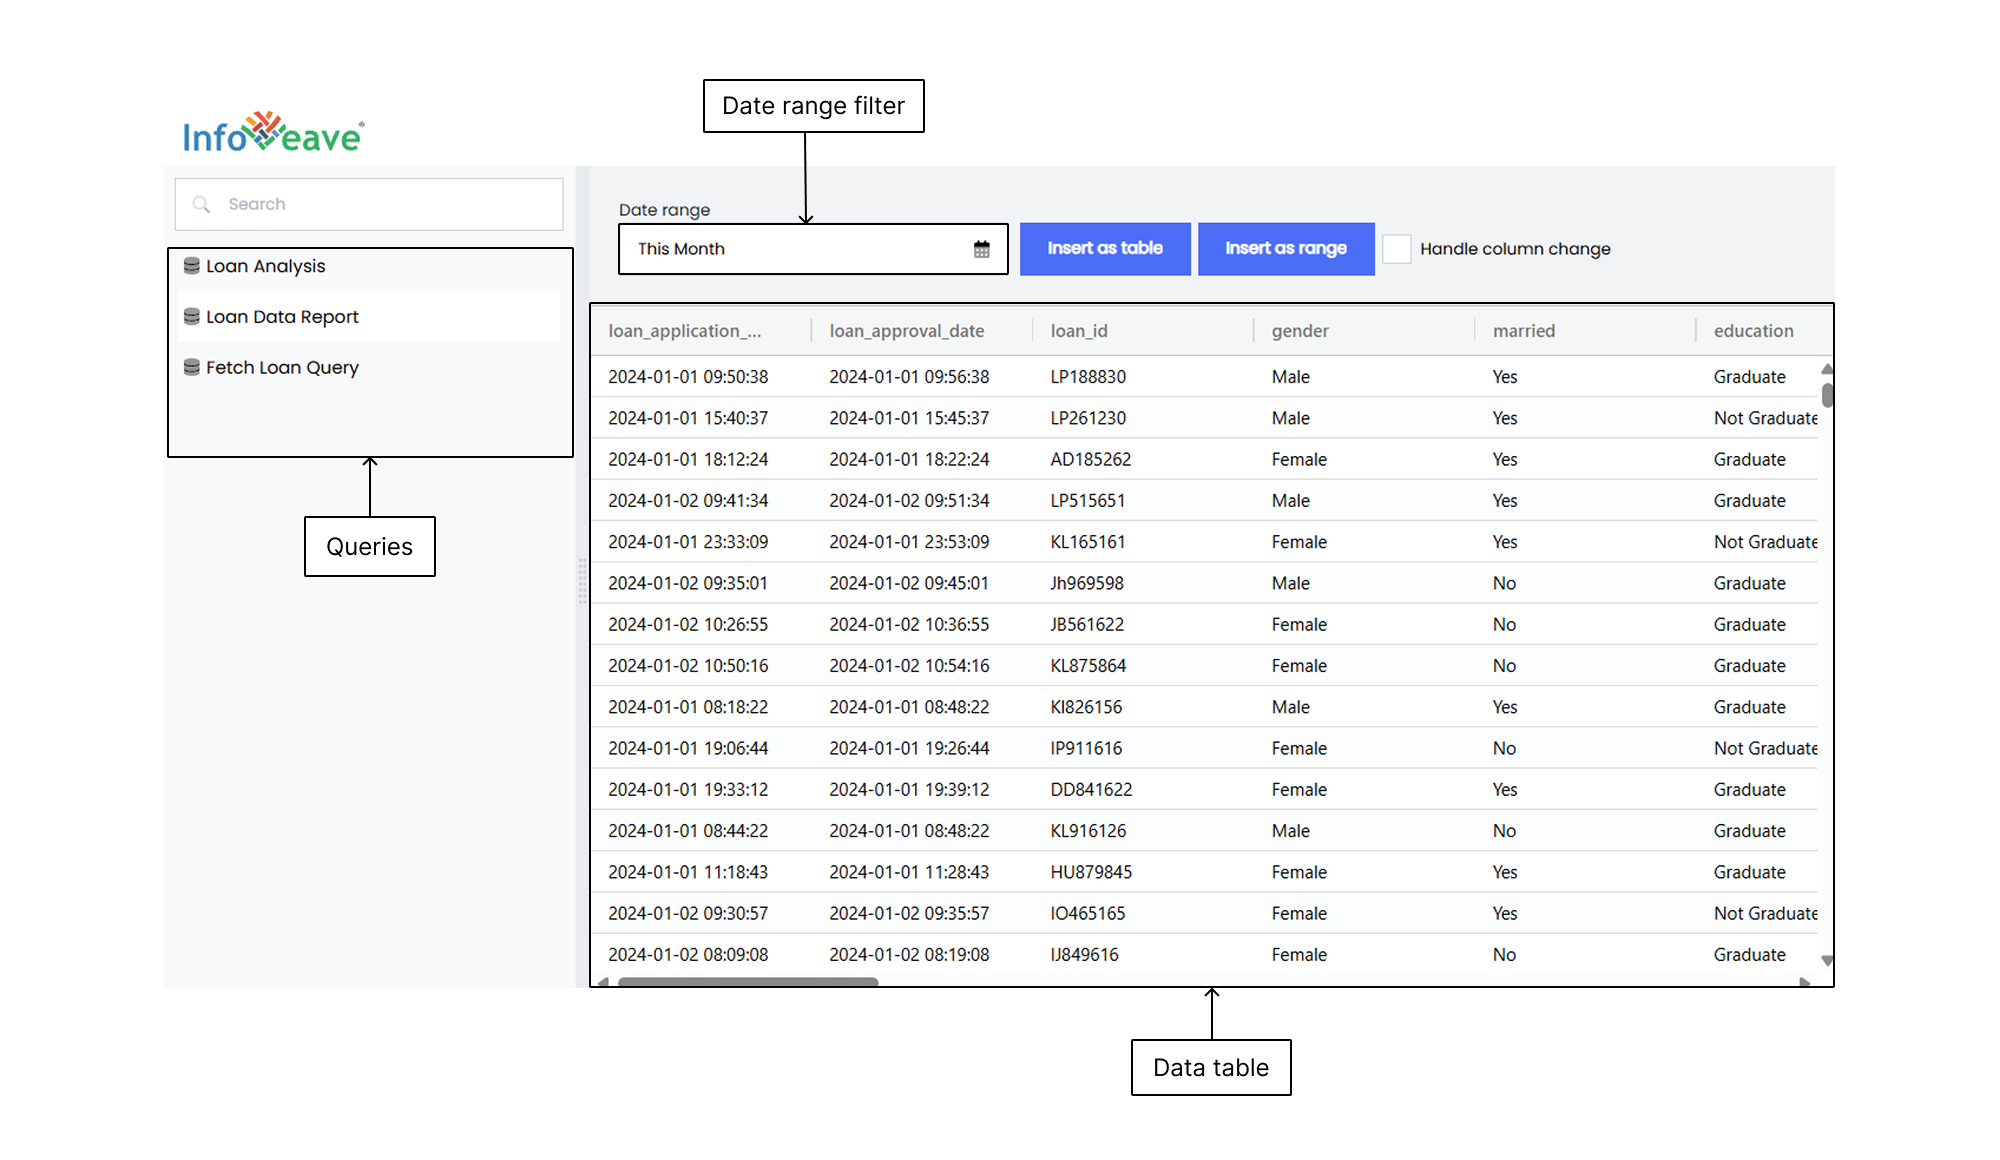
- To insert a data report, select the Insert Data option.
- Use the search bar to find the SQL query from the available list that you want to convert into a data report.
- After selecting the query, set the date range for preview. Select a specific Date Range for the Infoboard.
- Click the Insert as table button to add the data report to Microsoft Excel. You can choose between the Insert as Range or Insert as Data option.
Uploading Reports to Infoveave
Upload your template report back to Infoveave for easy sharing. This enables seamless collaboration and provides quick access to the analyzed data report within the platform.
- To upload the report to Infoveave, navigate to Studio Reports.
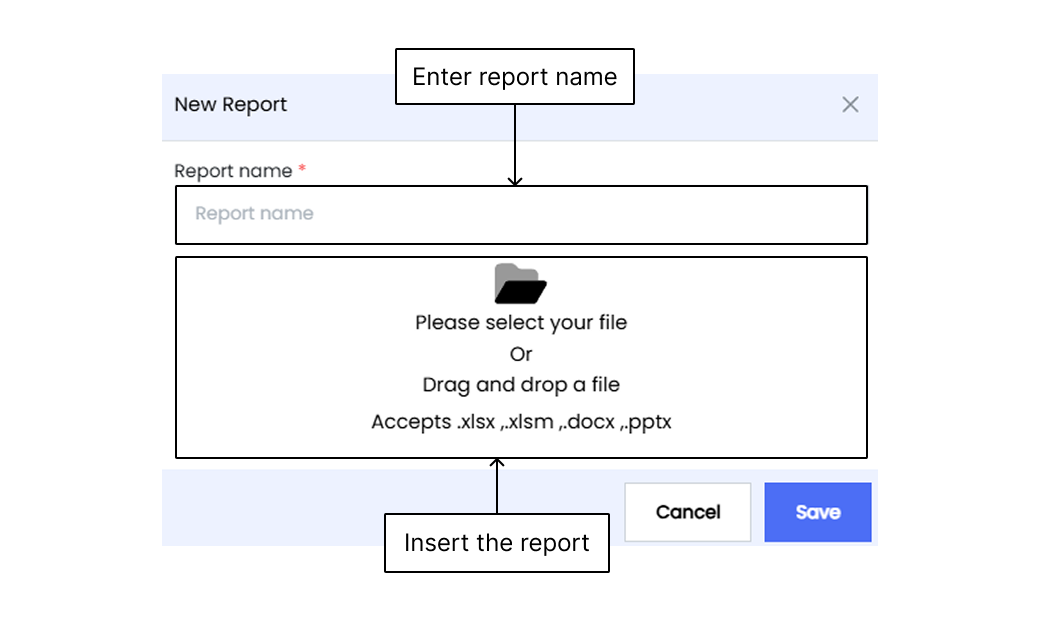
- Click on New Report. This opens the upload report dialog box.
- Give a name to your report.
- Choose the report from your local storage location using the file picker dialog. Supported file extensions are .xlsx, .xlsm, .docx, and .pptx.
- Click Save to store the report in Infoveave.
- The new report will be visible in Studio Reports.
- You can download or share the report from this section.
SQL Query Reports
SQL query reports in Infoveave offer a powerful way to access and analyze data from various Datasources using customized SQL queries. These reports allow you to retrieve specific datasets based on your unique requirements.
- To create an SQL query report, go to Studio Queries. All queries you create or that are shared with you are displayed under My Query and Shared Query.
- To create a new query, click on New Query.
- In the SQL query editor, write and save your SQL query.
- Navigate back to Studio Queries.
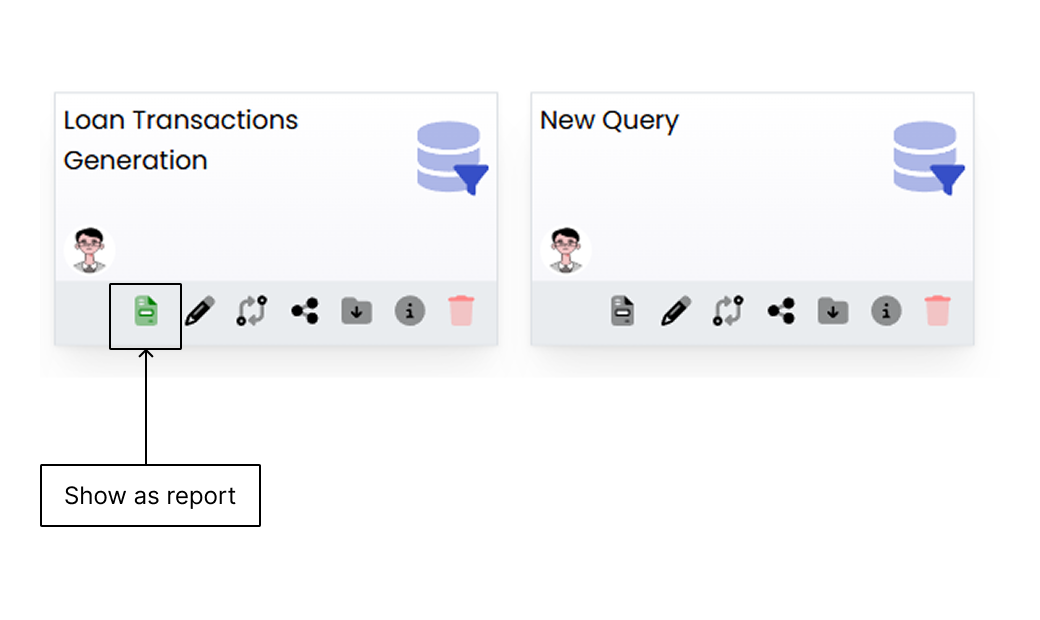
- Click on Show as report on the required query to generate a report based on that query.
- Go to Studio Report to view and access the generated report.
- To remove an SQL query report, click on the Show as Report option again.
- You may download or share your report from My Reports.
Managing Reports
To learn more about managing reports, visit Managing Reports.
Downloading Reports
In Infoveave, you can generate reports for a detailed analysis of any of your Datasources. Infoveave allows you to create custom reports based on specific date periods or filters. You can share the generated reports with any target audience within or outside your company using e-mail.
- Template Reports Create reports using Microsoft Excel, Microsoft Word and Microsoft PowerPoint templates.
- Query Reports Build reports using SQL queries to extract specific data.
- You can also download reports from Studio Reports.
Downloading Report from Insights
To download a report from Infoveave Insights with specific date range and dimension filters, follow these steps.
- Click on the Insights section in the Infoveave menu.
- Click on the desired report from the available list.
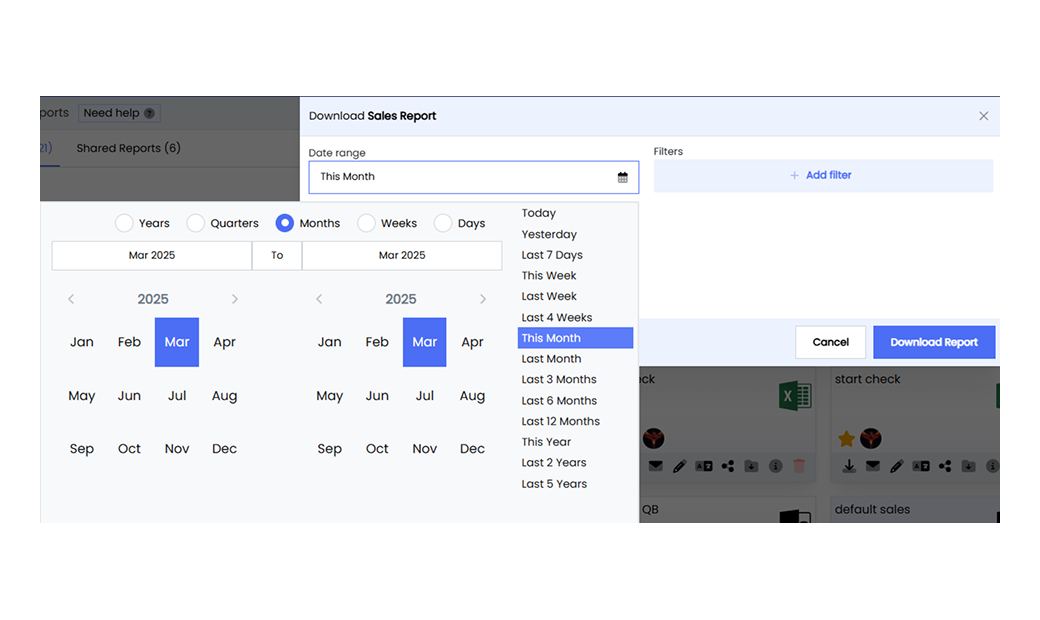
Applying Date Filters
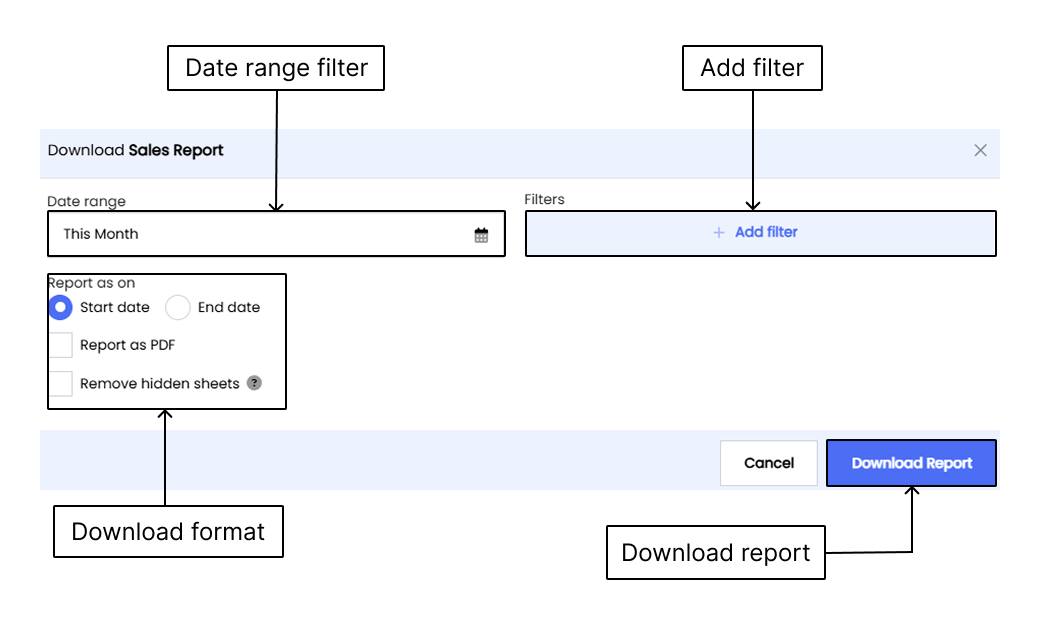
To apply a date range filter, select either the Start Date or End Date.
Start Date includes data from the beginning of the selected date range.
End Date includes data up to the end of the selected date range.
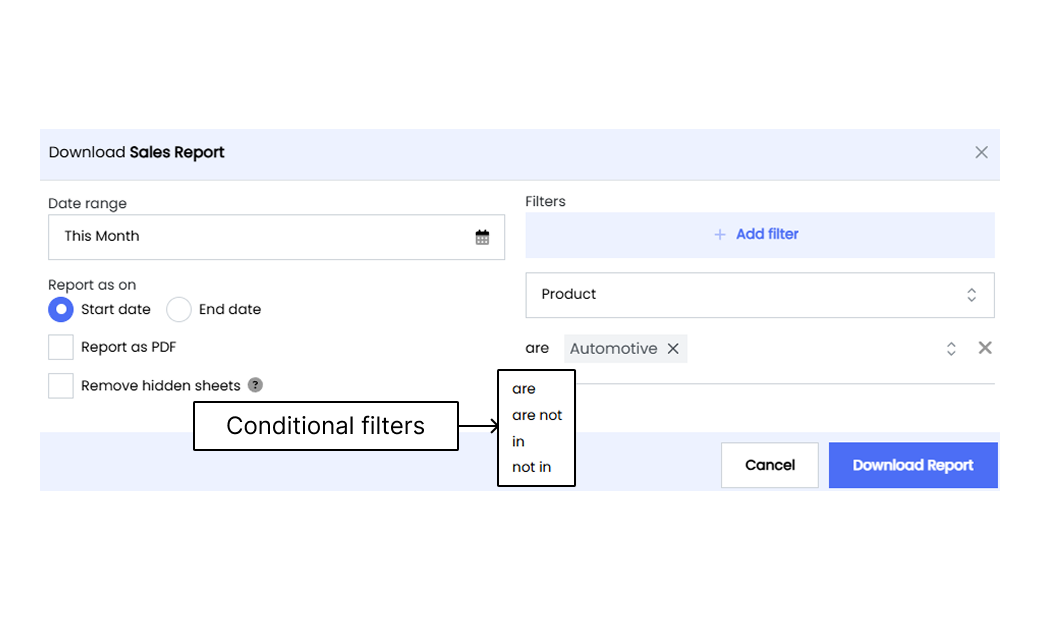
- Click on + Add Filter to apply dimension filters to the report, if needed.
- Select the specific dimensions you want to filter by.
- After selecting the dimension, choose a conditional filter from the available options.
- To access the conditional filters, click on the word “are”.
- Choose the desired report format. Select PDF or Excel (default) using the checkbox.
- Select any additional options if required.
Remove Hidden Sheets removes the Infoveave configuration sheet before downloading the report. - Click on the Download Report button to download the report.