Map Geo Json
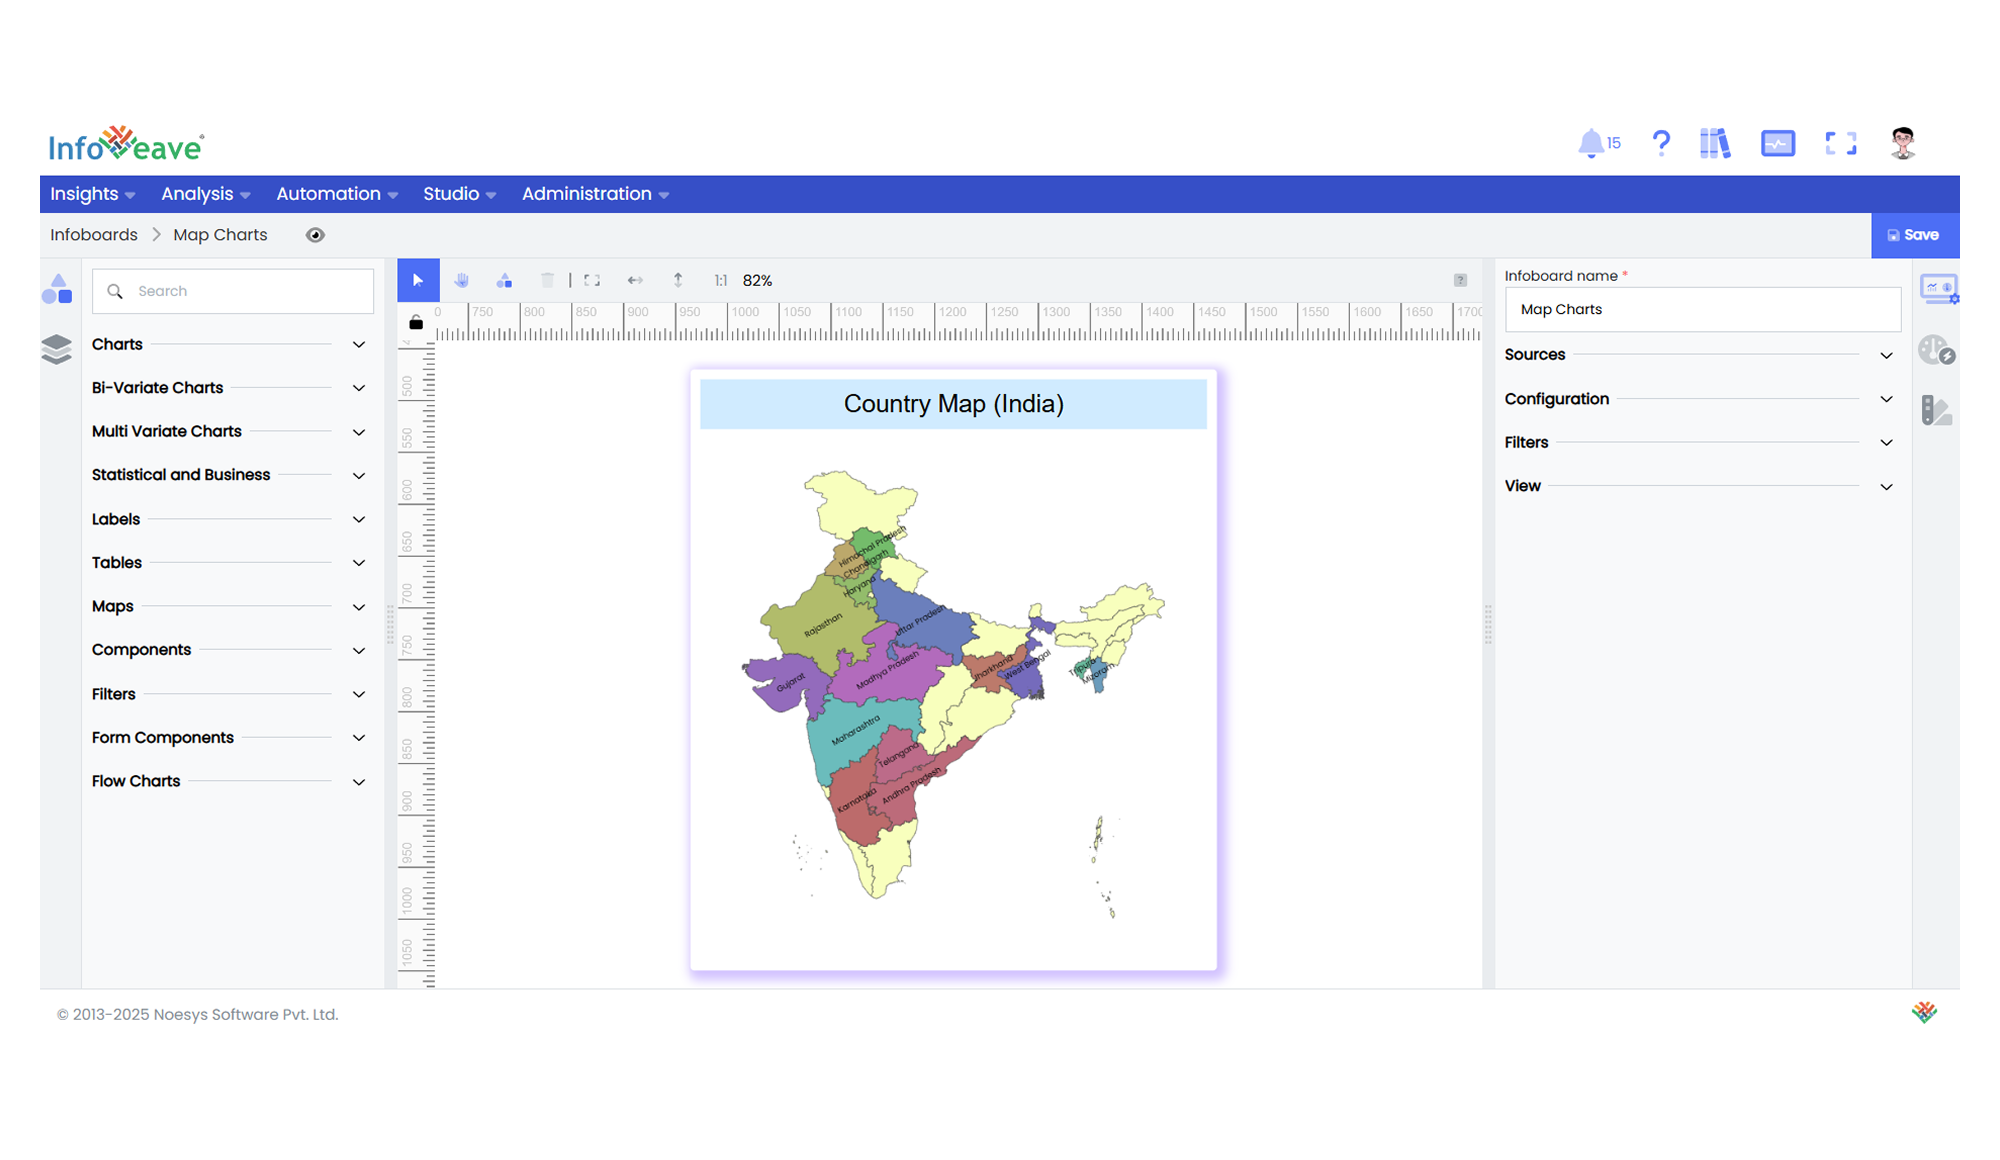
The Map GeoJSON Chart displays values across geographical regions by filling areas with colors based on numeric measures.
It uses GeoJSON map data to render regions and plot values, offering options for label control, color themes, and interactive drilldowns.
Use cases:
- Visualizing regional or country-level performance metrics.
- Displaying distribution of values across a geographical area.
- Highlighting high and low-performing regions using color gradients.
⚙️ Setup
- Drag the Map GeoJSON Chart widget from the chart library onto your designer workspace.
- Select the chart.
- Go to the Widget Configuration tab in the Configuration panel.
- Under the Configuration panel tab, select the Basic Configuration option to access essential settings for the Map GeoJSON Chart.
- Select the Source from which the chart will fetch its data.
- Map:
- Measure (Value) — Numeric value determining the fill intensity for each region.
- Dimension (Region) — Region or location name matching GeoJSON region properties.
- Optionally add a Date field for time-based filtering.
📊 Basic Configuration
| Configuration Item | Description |
|---|---|
| Source | The data source to query for chart values. |
| Measure (Value) | Numeric value used for region coloring. |
| Dimension (Region) | Region label to match with GeoJSON region names. |
| Date Field (optional) | Enables date-based filtering and drilldown capability. |
🎨 Chart Customizations
| Category | Options & Description |
|---|---|
| General | Theme, background, and interactivity options. |
| Title | Chart title, font, alignment, and visibility settings. |
| Sorting | Define custom sort order for regions if required. |
| Grid | Configure margins and layout alignment. |
| Map Options | Pick between various predefined maps. |
| Series | Configure label display, label rotation, custom fill colors, no-data color, and highlight color for regions. |
| Tooltip | Control tooltip content and formatting when hovering over regions. |
| Others | Select GeoJSON Map Source, Region Mapping Field (Region/ISO), and whether to normalize maps for sub-region adjustments (e.g. Alaska/Hawaii repositioning in US maps). |
📊 Example Visualization