Box Plot
The Box Plot Chart helps analyze the spread and distribution of data across categories.
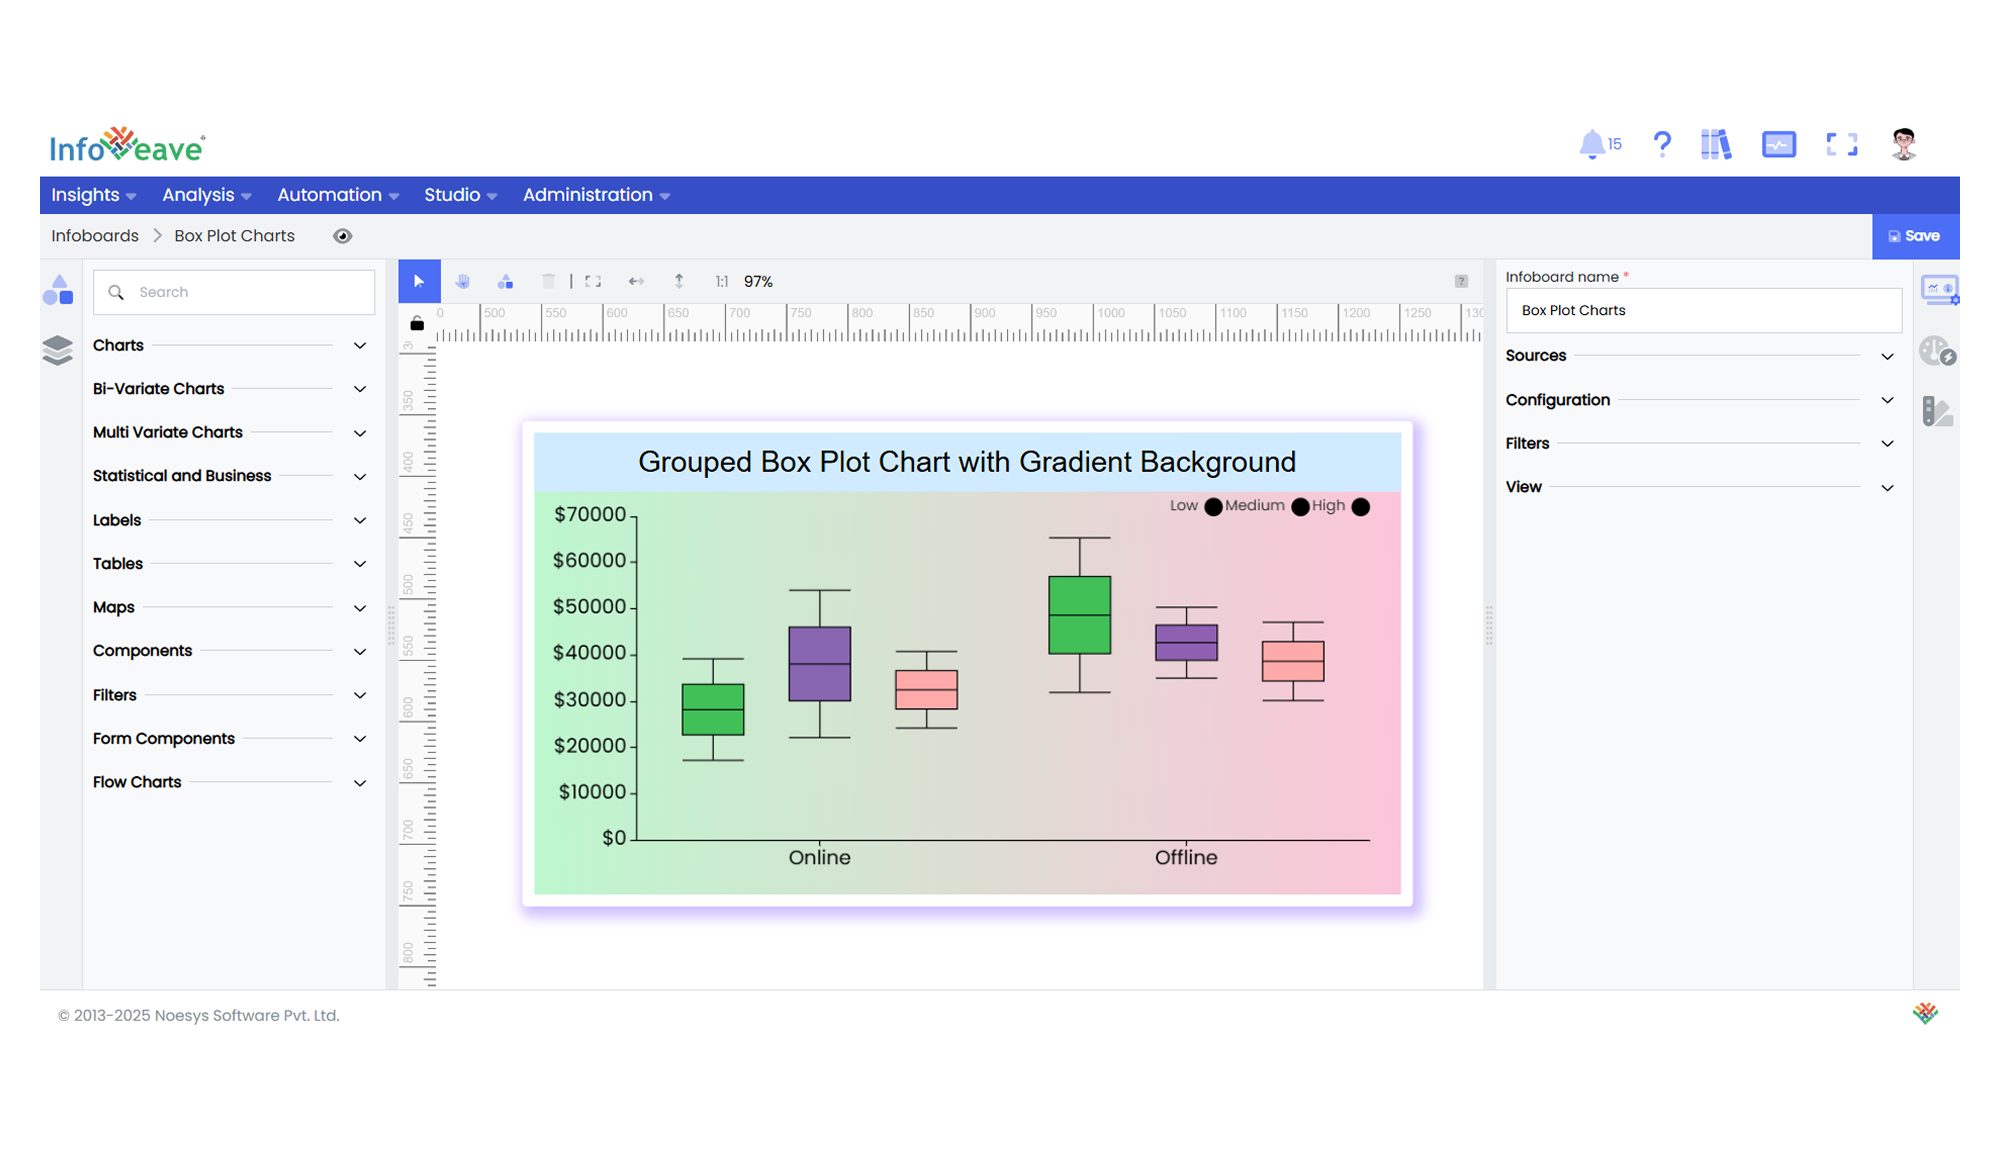
It displays a summary of data including the minimum, first quartile (Q1), median, third quartile (Q3), and maximum values, making it ideal for spotting outliers and variability.
Use cases:
- Statistical data analysis
- Displaying distributions of numerical data split by categories
- Highlighting outliers in performance metrics or survey responses
- Comparing spread of values across groups or dimensions
⚙️ Setup
- Drag the Box Plot Chart widget from the chart library onto your designer workspace.
- Select the chart.
- Go to the Widget Configuration tab in the Configuration panel.
- Under the Configuration panel tab, select the Basic Configuration option to access essential settings.
- Choose the Source to fetch data for the chart.
- Map:
- Measure (Value) — The numeric values for box plot computation.
- Dimension (Axis) — The categorical dimension on the X-axis.
- Group (optional) — To split data into multiple series.
📊 Basic Configuration
| Configuration Item | Description |
|---|---|
| Source | The data source to query for chart values. |
| Measure (Value) | Numeric value for the box plot computation. |
| Dimension (Axis) | Dimension for the X-axis categories. |
| Group (Optional) | Dimension to split series (optional for multi-series display). |
🎨 Chart Customizations
| Category | Options & Description |
|---|---|
| General | Theme, background, animations, and accessibility. |
| Title | Chart title, font, alignment, and visibility. |
| Sorting | Control sorting of categories on the axis. |
| Grid | Control chart padding, borders, and layout area. |
| Legend | Show or hide legends and position them. |
| Categorical Axis | Configure category axis labels, formatting, and ticks. |
| Numerical Axis | Set up numerical axis scale (linear/log), labels, and grid lines. |
| Series | Customize box color, borders, opacity, shadows, and symbol icons. |
| Tooltip | Configure tooltip content and format on hover. |
| Others | Box width range, multi-color mode, and box width min-max controls. |
📊 Example Visualization