Multi Measure Radar
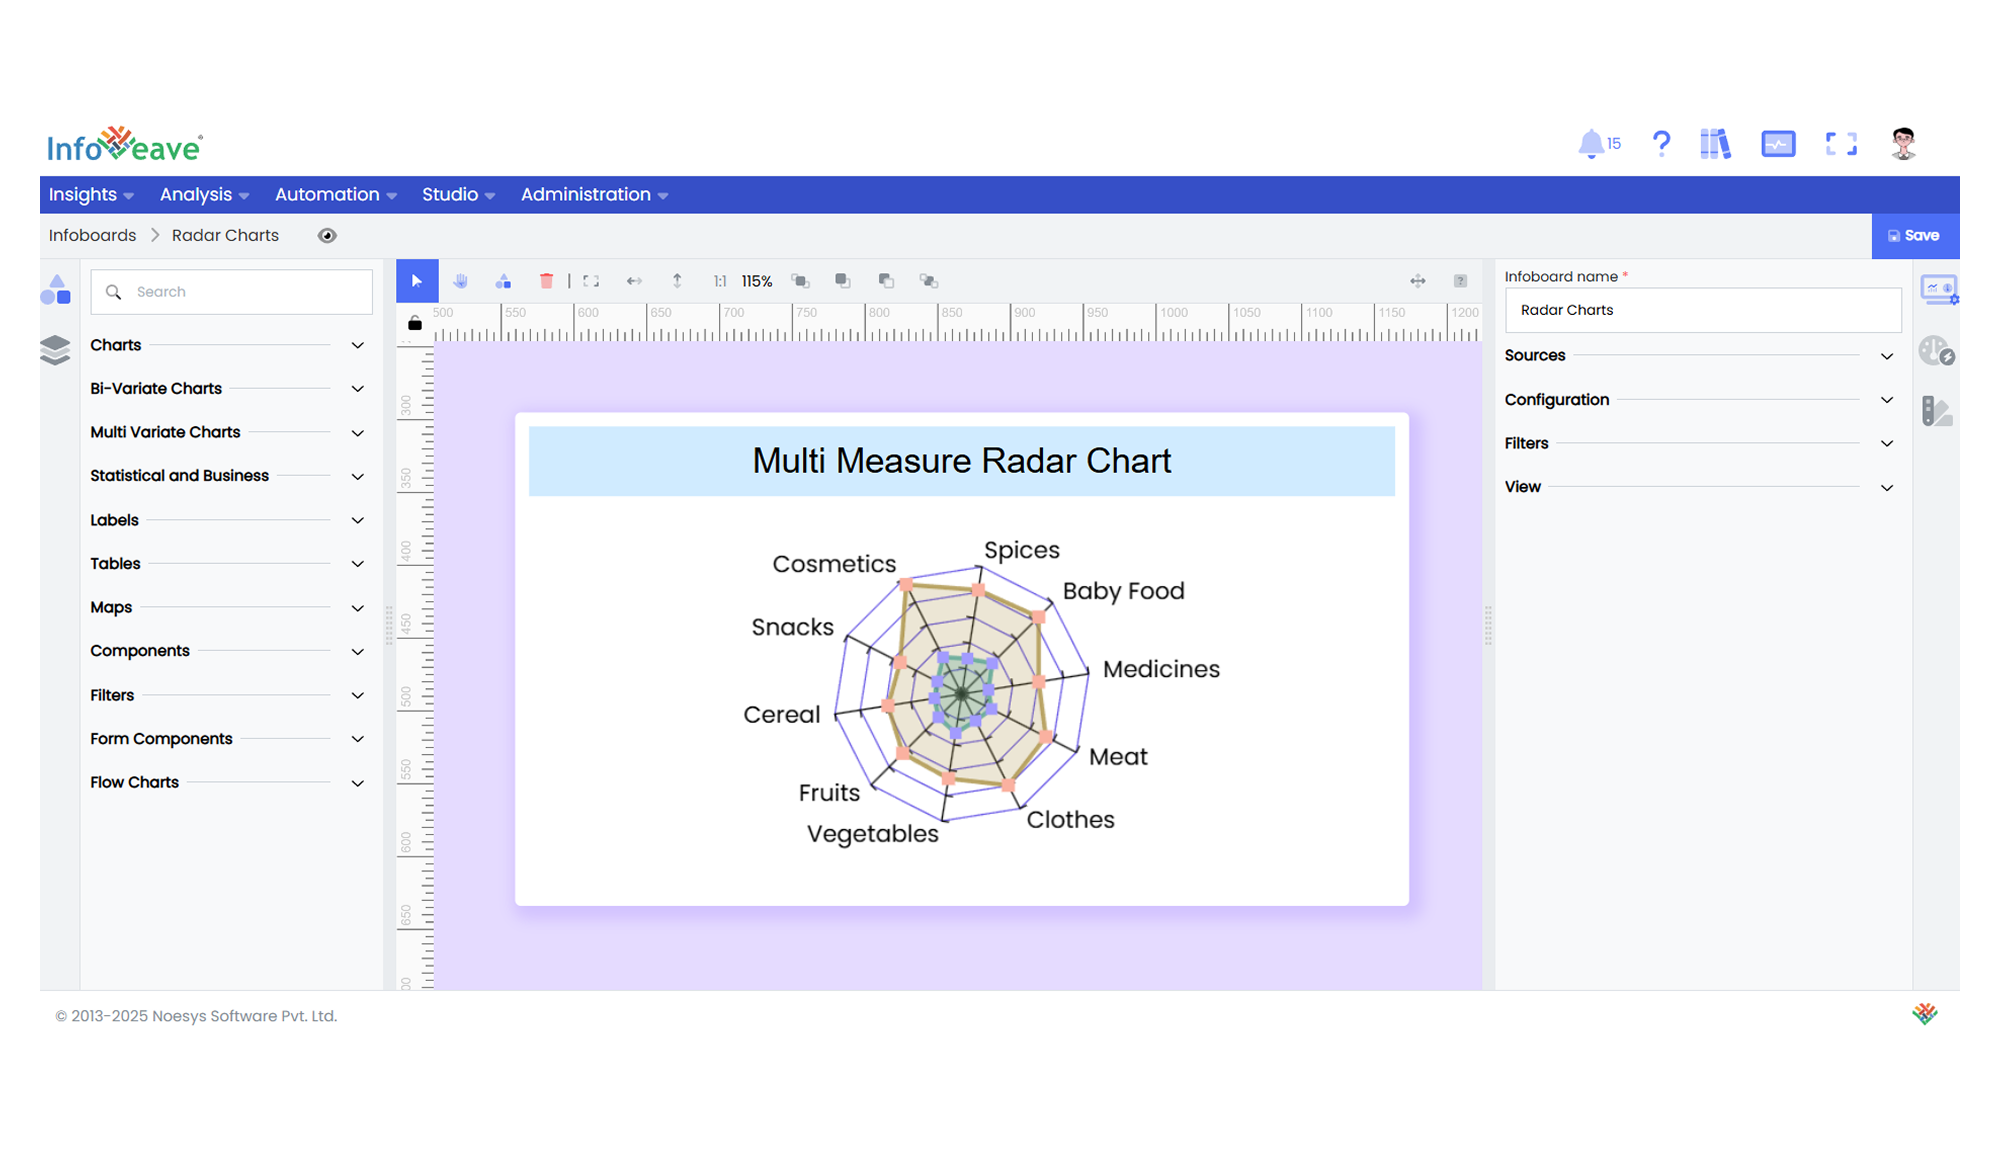
The Multi Measure Radar Chart displays multiple numeric measures on a common set of categorical axes (dimensions) arranged in a circular layout.
Each measure is plotted as a connected line (or filled area) radiating out from the center, allowing quick multi-variable comparisons for each category.
Use cases:
- Comparing multiple KPIs or measures across the same set of categories.
- Visualizing performance scores or benchmarks against multiple criteria.
- Highlighting outliers and gaps across several metrics on a single radial chart.
⚙️ Setup
- Drag the Multi Measure Radar Chart widget from the chart library onto your designer workspace.
- Select the chart.
- Go to the Widget Configuration tab in the Configuration panel.
- Under the Configuration panel tab, select the Basic Configuration option to access essential settings for the Multi Measure Radar Chart.
- Select the Source from which the chart will fetch its data.
- Map:
- (Optional) Add a Date field for time-based filtering.
📊 Basic Configuration
| Configuration Item | Description |
|---|---|
| Source | The data source to query for chart values. |
| Measure | One or more numeric values to display as separate lines/areas on the radar chart. |
| Dimension | Categorical values for the angular axis. |
| Date Field (optional) | Enables date-based filtering and drilldown capability. |
🎨 Chart Customizations
| Category | Options & Description |
|---|---|
| General | Theme, background, border, and interactivity options. |
| Title | Chart title, font, alignment, and visibility settings. |
| Sorting | Control sorting of dimension order. |
| Position | Adjust horizontal and vertical positioning of the radar within the chart. |
| Radar | Configure indicators, grid lines, shape (circle or polygon), and label styles. |
| Legend | Show/hide, position, and format for measure legends. |
| Series | Configure symbol type, size, color, line color, line width, area fill, label positions, and value formatting for each measure. |
| Tooltip | Tooltip content, format, and trigger configuration. |
| Others | Control whether overlapping labels are hidden. |
📊 Example Visualization