Word Cloud
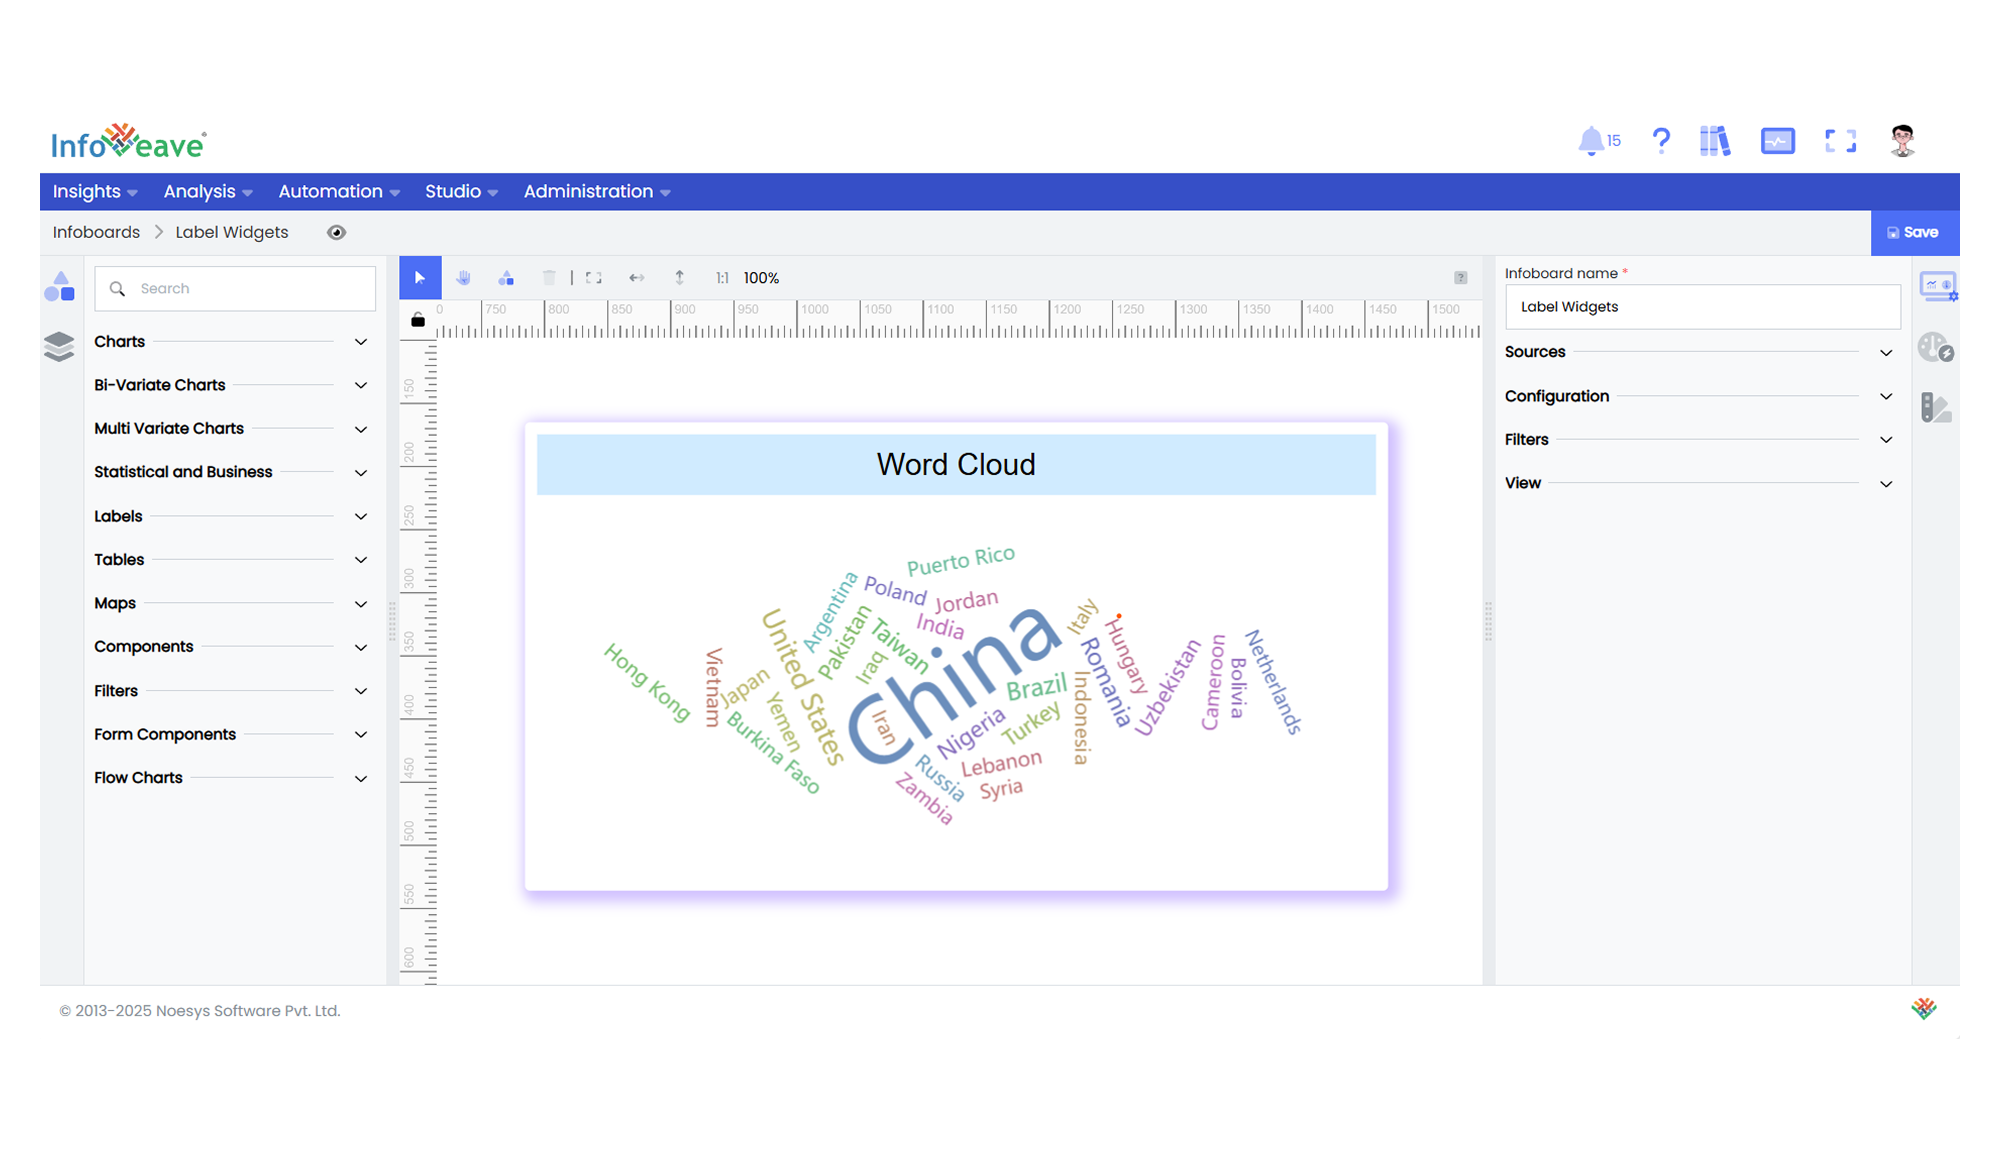
The Word Cloud Chart visualizes text-based data where each word’s size and color represent its corresponding value, typically frequency or importance.
It arranges words in a dynamic, cloud-like layout and optionally uses images or shapes to mask the word layout.
Use cases:
- Displaying keyword frequencies from survey responses or articles.
- Highlighting trending topics or popular terms from text data.
- Visualizing relative importance or volume of categories in a visually engaging way.
⚙️ Setup
- Drag the Word Cloud Chart widget from the chart library onto your designer workspace.
- Select the chart.
- Go to the Widget Configuration tab in the Configuration panel.
- Under the Configuration panel tab, select the Basic Configuration option to access essential settings for the Word Cloud Chart.
- Select the Source from which the chart will fetch its data.
- Map:
- Optionally add a Date field for time-based filtering.
📊 Basic Configuration
| Configuration Item | Description |
|---|---|
| Source | The data source to query for chart values. |
| Measure | Numeric value used to scale the size of each word. |
| Dimension | The text field whose values are displayed as words in the chart. |
| Date Field (optional) | Enables date-based filtering and drilldown capability. |
🎨 Chart Customizations
| Category | Options & Description |
|---|---|
| General | Theme, background, and interactivity options. |
| Title | Chart title, font, alignment, and visibility settings. |
| Grid | Adjust padding or spacing around the Word Cloud area. |
| Series | Control word colors, size range, font family, and text orientation. |
| Tooltip | Tooltip content, format, and triggers for word hover details. |
| Others | Configure Shape (circle, diamond, star, etc.), Mask Image, Word Size Range, Rotation Range, Rotation Step, Word Gap, and Font Family. |
📊 Example Visualization