Bubble Line
The Bubble Line Chart is a hybrid visualization combining a line chart with variable-sized markers (bubbles) plotted along the line.
Each bubble’s position is determined by a dimension and a measure, while the bubble size represents a second measure, enabling multivariate analysis within a trend-based layout.
Use cases:
- Visualizing value trends over a sequence or category, while encoding an additional quantitative value via bubble size.
- Showing distribution patterns, outliers, and magnitudes within line charts.
- Comparing series values and bubble magnitudes simultaneously.
⚙️ Setup
- Drag the Bubble Line Chart widget from the chart library onto your designer workspace.
- Select the chart.
- Go to the Widget Configuration tab in the Configuration panel.
- Under the Configuration panel tab, select the Basic Configuration option to access essential settings for the Bubble line chart.
- Select the Source from which the chart will fetch its data.
- Map:
- Measure (Value) — Numeric value determining the bubble’s Y-axis (or X if vertical) position.
- Measure (Size) — (Optional) Numeric value for the marker (bubble) size.
- Dimension (Axis) — Categorical or sequential value for the primary axis.
- Group — (Optional) Categorical value to split lines into separate series.
- Optionally add a Date field for time-based filtering.
📊 Basic Configuration
| Configuration Item | Description |
|---|---|
| Source | The data source to query for chart values. |
| Measure (Value) | Numeric value determining the bubble’s Y (or X if vertical) position along the line. |
| Measure (Size) | (Optional) Numeric value controlling the size of each marker. |
| Dimension (Axis) | Categorical or sequential value for the primary axis labels. |
| Group | (Optional) Grouping field to split lines into multiple series. |
| Date Field (optional) | Enables date-based filtering and drilldown capability. |
🎨 Chart Customizations
| Category | Options & Description |
|---|---|
| General | Theme, background, border, and interactivity options. |
| Title | Chart title, font, alignment, and visibility settings. |
| Sorting | Control sorting of categories along the axis. |
| Grid | Manage padding and chart grid layout. |
| Legend | Show/hide, position, and format for series legends. |
| HeatMap | Apply color gradients based on value ranges. |
| Categorical Axis | Customize category axis labels, rotation, and intervals. |
| Numerical Axis | Adjust value axis scale, formatting, and log scale. |
| Series | Configure line style, color, bubble shape, and series markers. |
| Tooltip | Tooltip content, format, and triggers. |
| Others | Set Orientation (Horizontal / Vertical) and Min/Max Symbol Size for bubbles. |
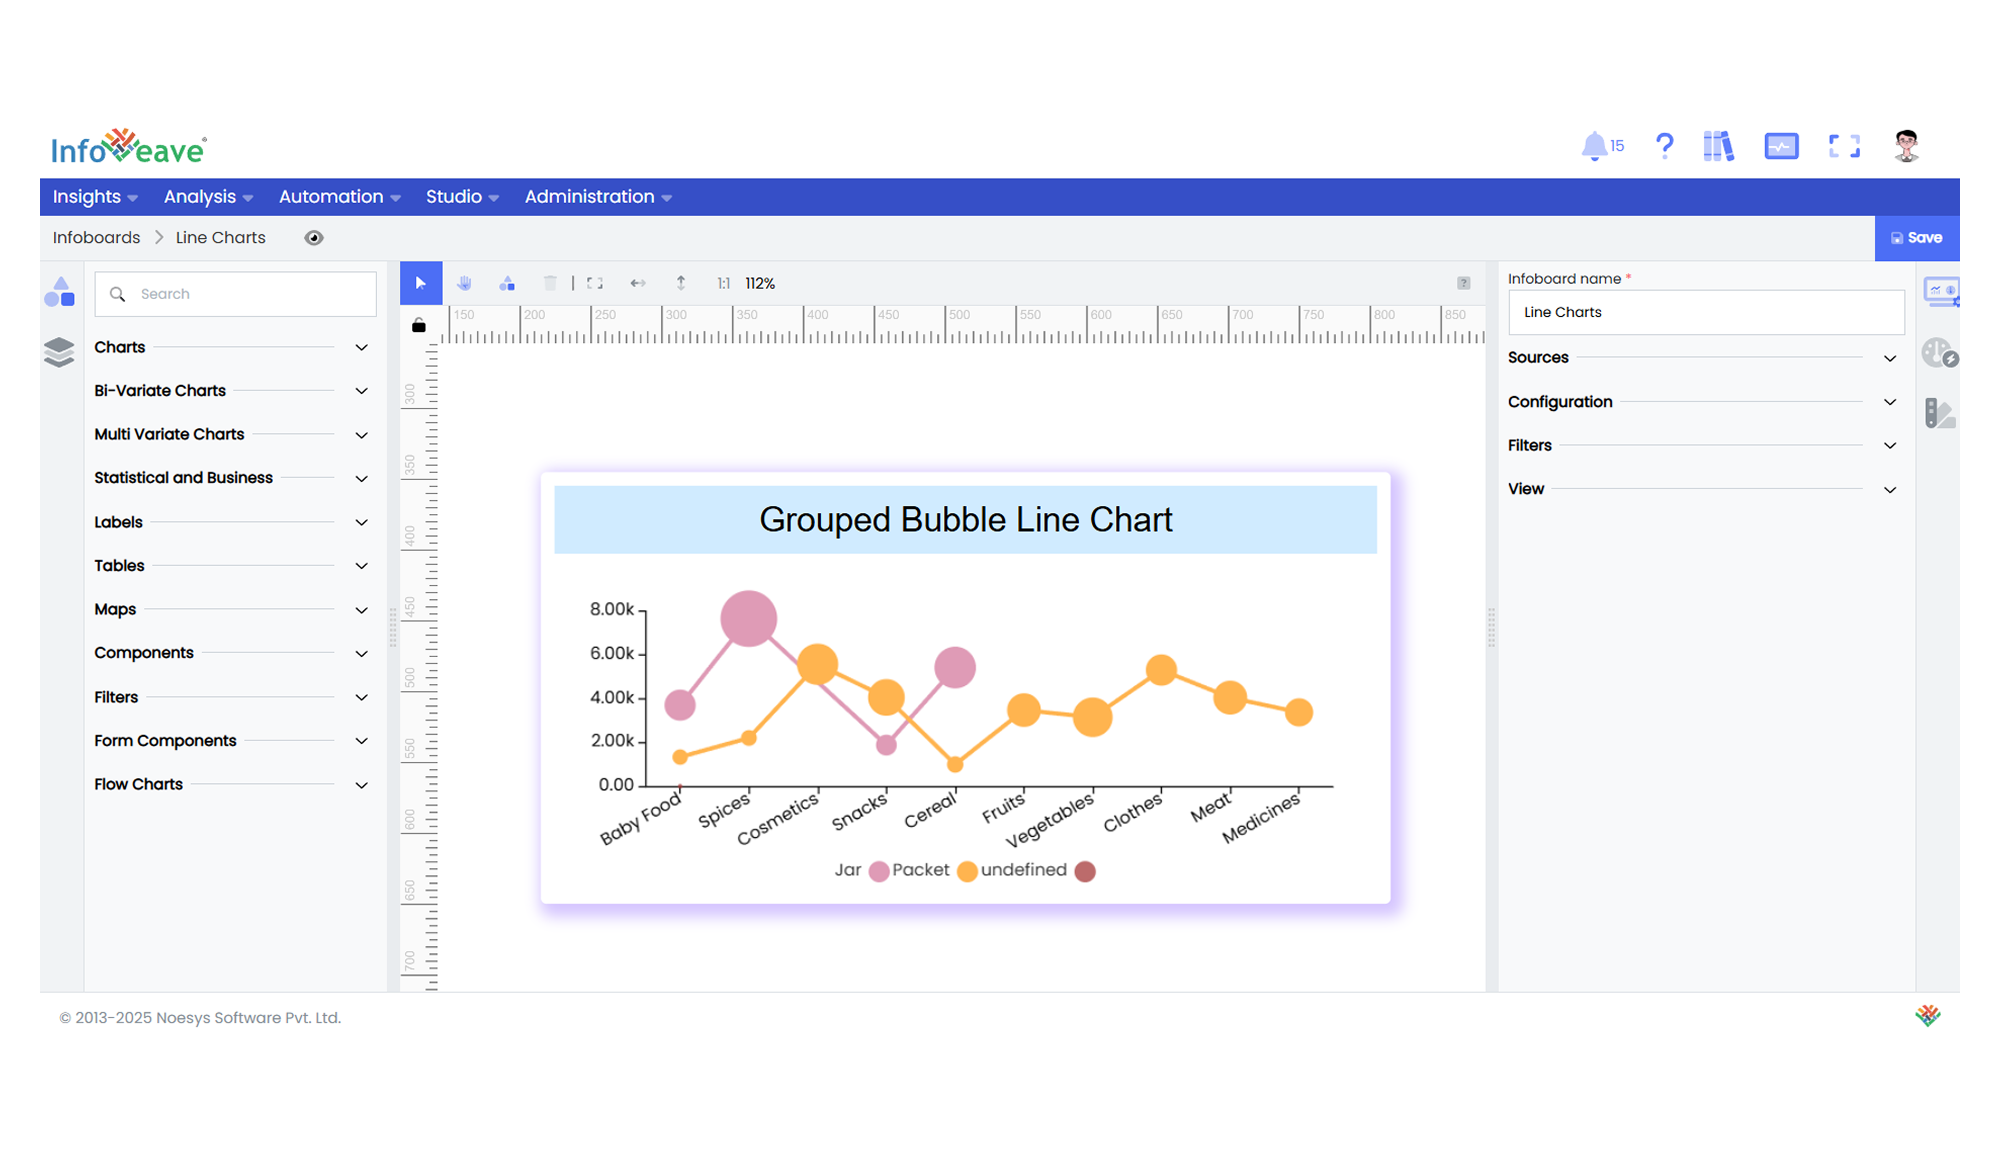
📊 Example Visualization