Bi-Variate Line
A BiVariate Line Chart is a versatile multi-panel line chart visualization that plots series of continuous data (like trends or time series) grouped by an Axis dimension and split into multiple grids based on a Split dimension. Optionally, a Group dimension can further break down lines within each panel.
It also supports switching chart orientation between horizontal (standard) and vertical, useful for comparing multiple measures or groups across categories.
Key Features:
- Multi-panel (small multiples) line charts split by a Split dimension.
- Optional Group dimension to plot multiple series within each panel.
- Toggle between Horizontal (X-axis = categories) or Vertical (Y-axis = categories) layouts.
- Custom line styles, markers, colors, and shadow effects.
- Interactive tooltips and zoom controls for each grid.
- Supports dynamic pivoting and sorting.
- Heatmap coloring based on value ranges.
Use Cases:
- Year-on-year trend comparisons split by region or product category.
- Parallel KPI trends across multiple business units.
- Sensor readings split by equipment ID.
- Monthly sales trends per region.
⚙️ Setup
- Add the BiVariate Line Chart widget from the chart library onto your designer workspace.
- Select the chart.
- Go to the Widget Configuration tab in the Customize panel.
- Under the Configuration tab, select the Basic Configuration option to access the essential settings for the bi variate line chart.
- Select the Source which the chart will pull the data from the option.
- Map:
- Value (Measure) — The numeric value plotted along the Y-axis (or X if vertical).
- Axis (Dimension) — The categorical or date/time value for the independent axis.
- Split (Dimension) — The dimension used to split charts into grids.
- (Optional) Group (Dimension) — Categorizes multiple lines within a panel.
- Optionally add a Date field for time-based filtering.
- Enable Hide Zero Values to omit symbols with zero values if needed.
📊 Basic Configuration
| Configuration Item | Description |
|---|---|
| Source | Source providing the data for measures and dimensions. |
| Value | Numeric value for each data point. |
| Axis | Dimension for the X-axis (or Y if vertical). |
| Split | Dimension to split data into multiple line charts. |
| Group (optional) | Secondary dimension to group multiple lines within each grid. |
🎨 Chart Customizations
| Category | Options & Description |
|---|---|
| General | Modify the chart’s general appearance, including the background color, borders, shadows, and drill-out choices. |
| Title | Enable and customize chart title text, alignment, font, and color. |
| Sorting | Define custom sort orders for categories along the X and Y axes. |
| Grid | Adjust chart margins, grid spacing, and padding around the matrix area. |
| Legend | Toggle visibility, position, orientation, and customize legend labels and icons. |
| HeatMap | Configure a visual color map to represent value intensity with a gradient. |
| Categorical Axis (X, Y) | Customize axis labels, intervals, rotation, visibility, and range sliders for both axes. |
| Numerical Axis | Set axis type, scale (linear/log), and formatting for numeric values. |
| Series | Customize line styles, markers, colors, and shadows. |
| Tooltip | Control tooltip content, formatting, and visibility on hover. |
| [Others] | Toggle chart orientation (Horizontal or Vertical), and apply box shadows. |
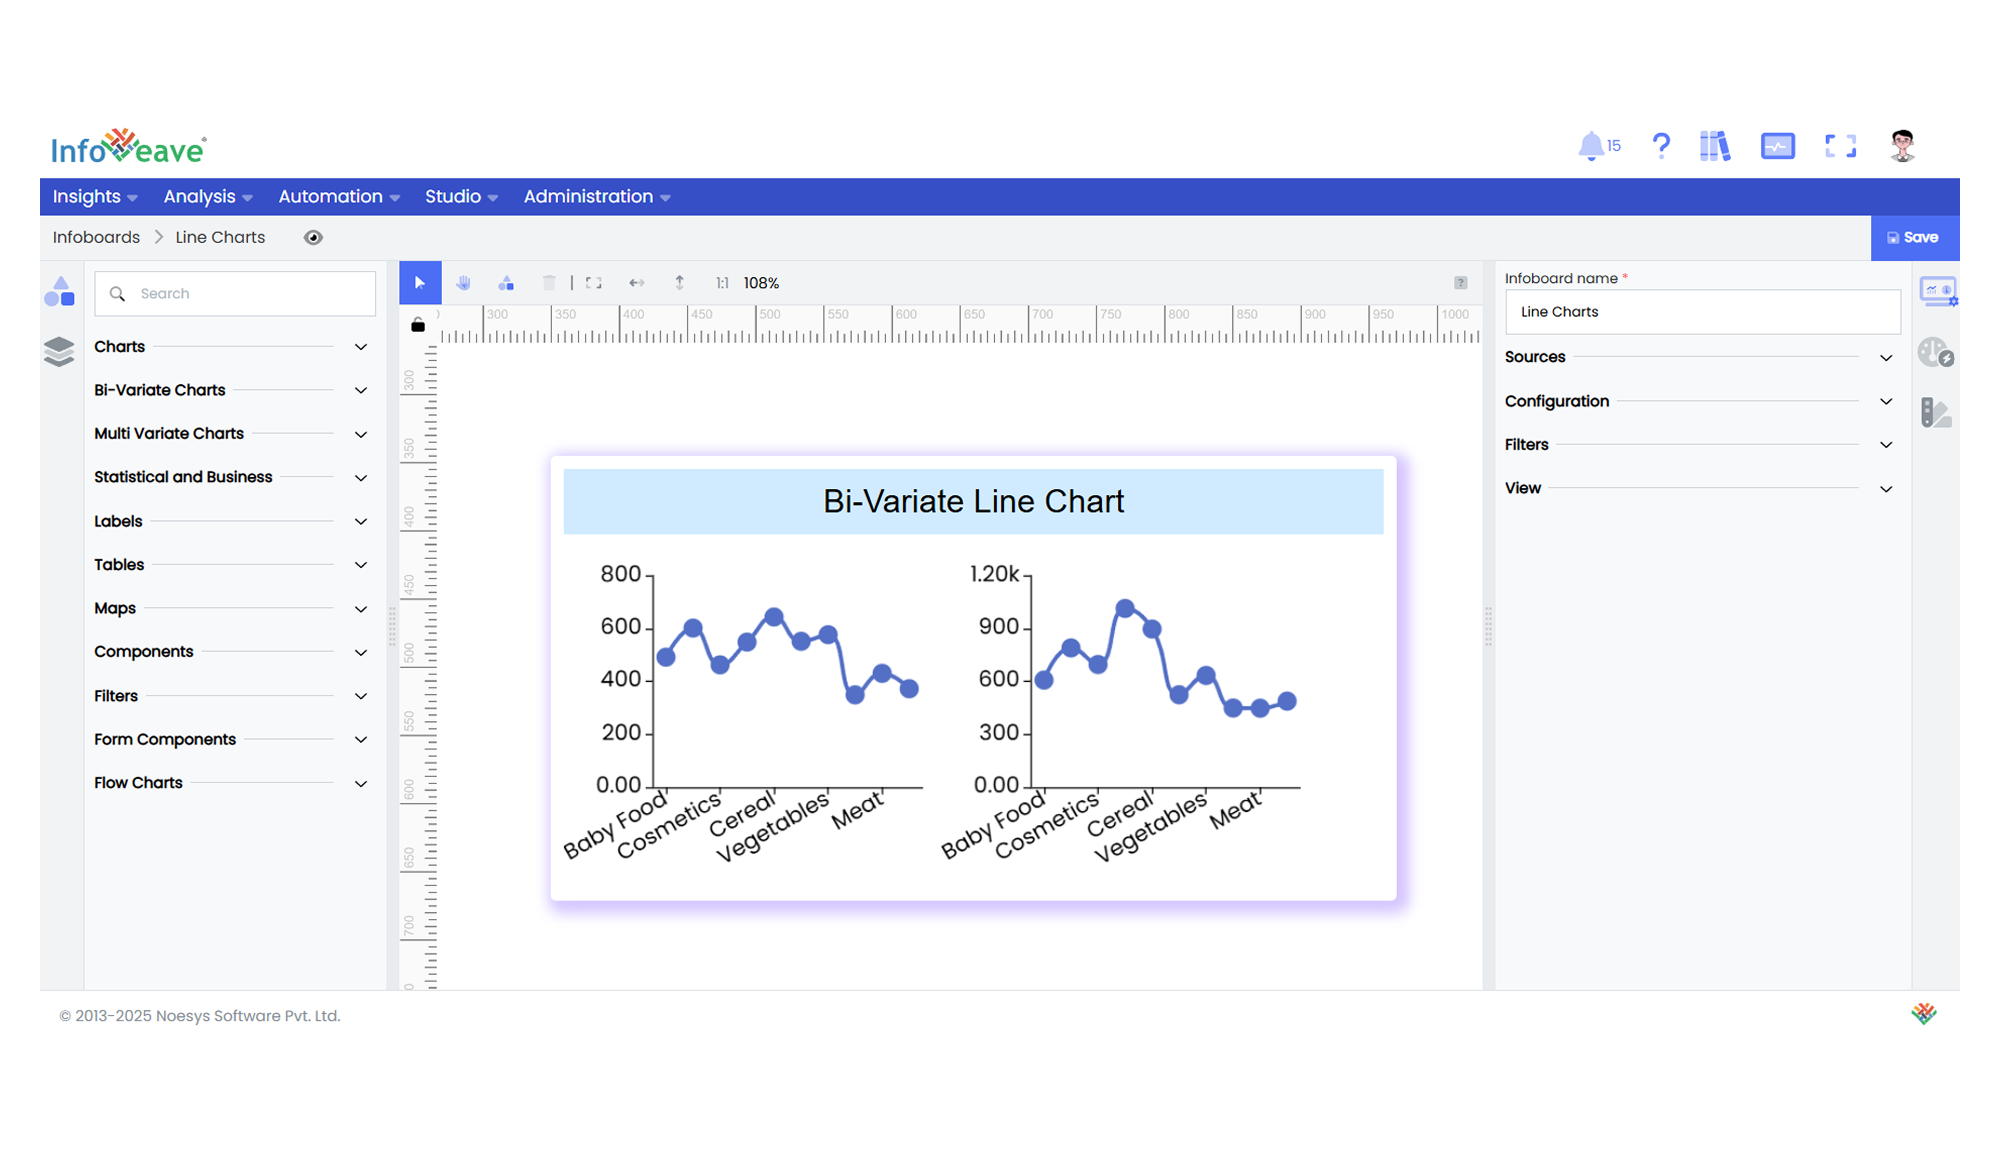
📊 Example Visualization