World Map Geo Json
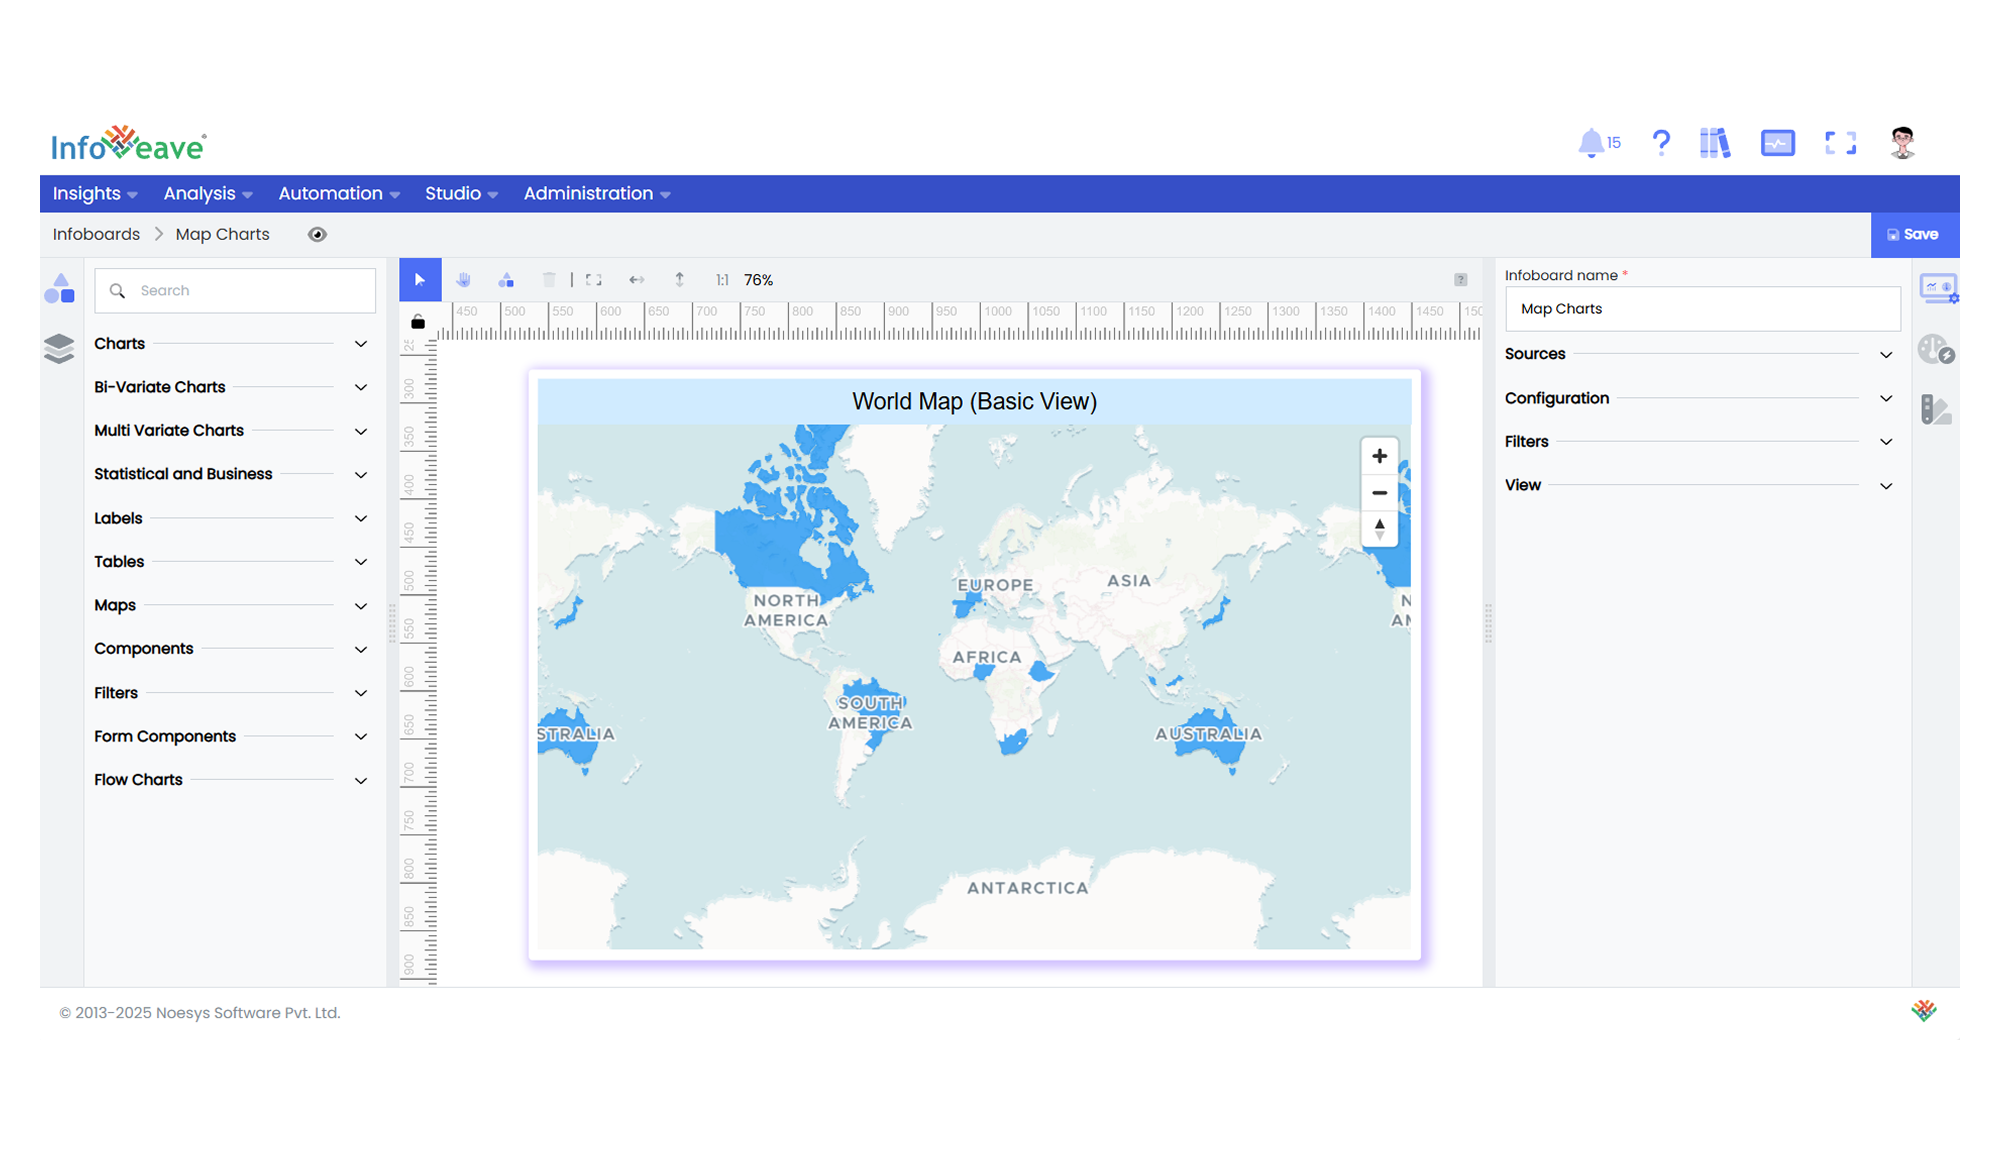
The World Map GeoJSON Chart displays values across a geographical map using a combination of vector tile basemaps and GeoJSON data overlays.
It colors each region based on corresponding numeric measures and offers label and tooltip popups positioned using geographic centroids.
Use cases:
- Visualizing country-level or regional business performance.
- Displaying distribution of key metrics on a map background.
- Interactive geo drilldowns and region-specific popups.
⚙️ Setup
- Drag the World Map GeoJSON Chart widget from the chart library onto your designer workspace.
- Select the chart.
- Go to the Widget Configuration tab in the Configuration panel.
- Under the Configuration panel tab, select the Basic Configuration option to access essential settings for the World Map GeoJSON Chart.
- Select the Source from which the chart will fetch its data.
- Map:
- Measures — One or more numeric measures controlling region fill and popup content.
- Dimension (Region) — Region label matching GeoJSON region names.
- Optionally add a Date field for time-based filtering.
📊 Basic Configuration
| Configuration Item | Description |
|---|---|
| Source | The data source to query for chart values. |
| Measures | One or more numeric values determining region colors and popup values. |
| Dimension (Region) | Region label to match with GeoJSON region properties. |
| Date Field (optional) | Enables date-based filtering and drilldown capability. |
🎨 Chart Customizations
| Category | Options & Description |
|---|---|
| General | Theme, background, and interactivity options. |
| Title | Chart title, font, alignment, and visibility settings. |
| Sorting | Define custom sort order for regions if needed. |
| Grid | Manage padding and chart layout alignment. |
| Series | Configure region fill colors (custom/automatic), label display, offset, font style, font size, and color. |
| Map Options | Select between various predefine maps, Configure blank color , map styles. |
| Tooltip | Control popup content, font styling, and formatting on hover events. |
| Others | Set GeoJSON Source, Map Style (Blank, DataViz, Basic, Satellite), No-Data Color, and Dimension Mapping (Region/ISO). |
📊 Example Visualization