Parallel Axis
The Parallel Axis Chart (also known as a Parallel Coordinates Plot) displays multivariate data by plotting each variable on a separate parallel axis, connecting data points belonging to the same record with a line.
This chart is ideal for comparing patterns across multiple variables simultaneously or finding clusters and outliers in multivariate datasets.
Use cases:
- Multivariate performance comparison across multiple measures.
- Identifying trends, correlations, or outliers in high-dimensional data.
- Visualizing complex patterns in operational, financial, or research data.
⚙️ Setup
- Drag the Parallel Axis Chart widget onto your designer workspace.
- Select the chart.
- Go to the Widget Configuration tab.
- Under the Configuration panel tab, select the Basic Configuration option.
- Select your Source for the chart.
- Map:
- Optionally add a Date field for time-based filtering.
📊 Basic Configuration
| Configuration Item | Description |
|---|---|
| Source | Data source to fetch the chart data from. |
| Measure | 2–10 numeric values, each displayed as a parallel axis. |
| Dimension | Category or label grouping each line on the chart. |
| Date Field (optional) | Enables date-based filtering and drilldown functionality. |
🎨 Chart Customizations
| Category | Options & Description |
|---|---|
| General | Theme, interactivity, borders, and chart decals. |
| Title | Chart title, font, alignment, and visibility options. |
| Sorting | Sort order of data points by measure values or series name. |
| Grid | Control margins, padding, and positioning of the chart grid. |
| Legend | Show or hide legend and customize its appearance. |
| HeatMap | Optional color scale mapping to a selected measure. |
| Parallel Axis | Axis scaling, formatting, labels, and custom min/max ranges. |
| Series | Customize line appearance: smoothness, width, type, color, gradient fill, etc. |
| Tooltip | Enable and configure tooltips for individual points or lines. |
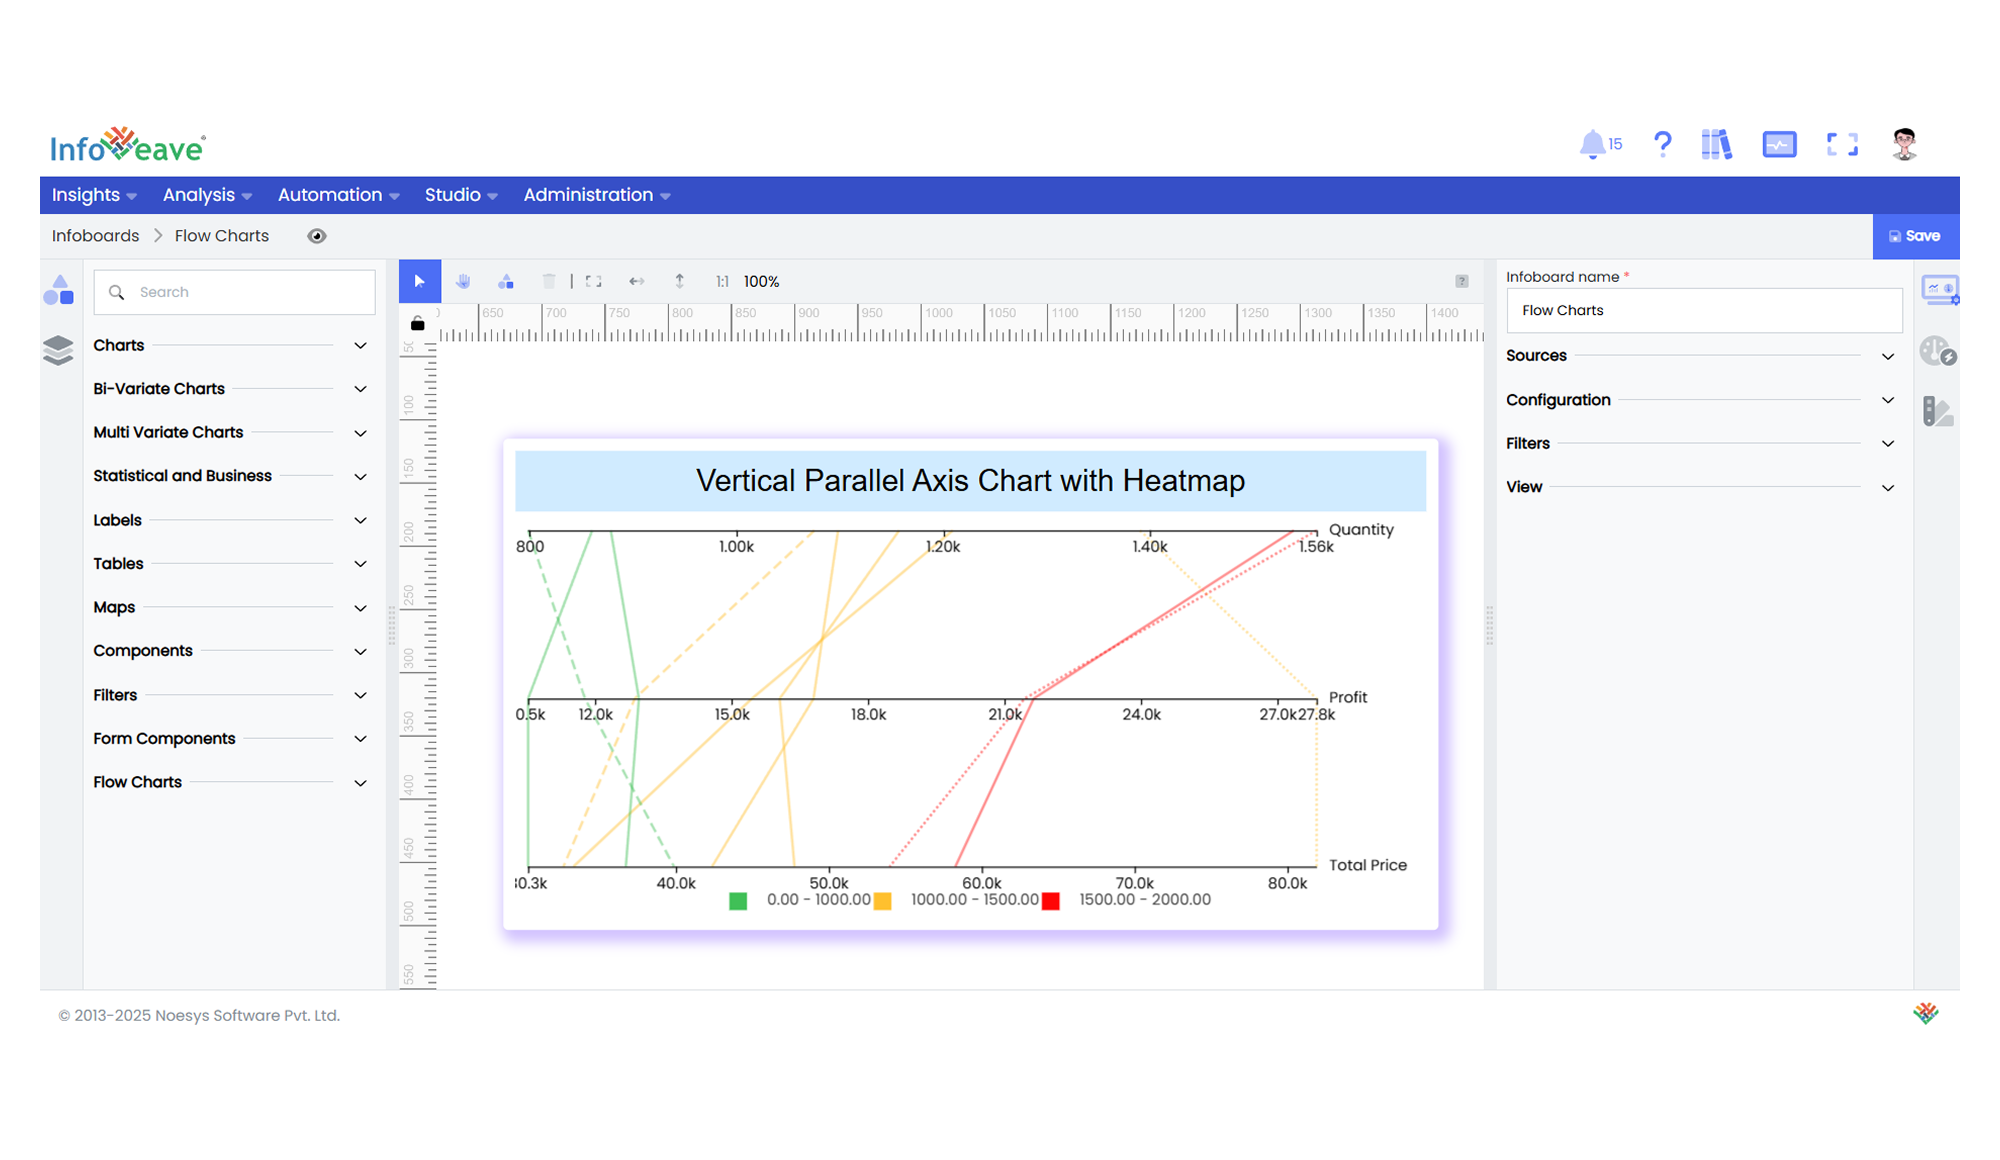
| Others | Layout orientation: Horizontal or Vertical. |
📊 Example Visualization