Bubble
The Bubble Chart is a variant of the scatter plot where each data point is visualized as a bubble.
The position of each bubble is determined by a dimension and a measure, while the bubble size can optionally represent a third quantitative value.
Bubble charts can optionally use categorical groups to distinguish series visually and can be oriented both horizontally and vertically.
Use cases:
- Visualizing relationships between three variables: position (X), value (Y), and bubble size.
- Displaying distributions and clusters within a dataset.
- Comparing magnitude, category, and trend in a single visual layout.
⚙️ Setup
- Drag the Bubble Chart widget from the chart library onto your designer workspace.
- Select the chart.
- Go to the Widget Configuration tab in the Configuration panel.
- Under the Configuration panel tab, select the Basic Configuration option to access essential settings for the Bubble chart.
- Select the Source from which the chart will fetch its data.
- Map:
- Measure (Value) — Numeric value for bubble positioning on one axis.
- Measure (Size) — (Optional) Numeric value controlling the bubble size.
- Dimension (Axis) — Categorical or sequential value for primary axis labels.
- Group — (Optional) Categorical value to split the bubbles into separate series.
- Optionally add a Date field for time-based filtering.
📊 Basic Configuration
| Configuration Item | Description |
|---|---|
| Source | The data source to query for chart values. |
| Measure (Value) | Numeric value determining the bubble’s Y (or X if vertical) position. |
| Measure (Size) | (Optional) Numeric value controlling each bubble’s size. |
| Dimension (Axis) | Categorical or sequential value for the primary axis. |
| Group | (Optional) Grouping field to split the bubble series. |
| Date Field (optional) | Enables date-based filtering and drilldown capability. |
🎨 Chart Customizations
| Category | Options & Description |
|---|---|
| General | Theme, background, border, and interactivity options. |
| Title | Chart title, font, alignment, and visibility settings. |
| Sorting | Control sorting of categories. |
| Grid | Manage padding and chart grid layout. |
| Legend | Show/hide, position, and format for series legends. |
| HeatMap | Apply color gradients based on value ranges (bubble color). |
| Categorical Axis | Customize category axis labels, rotation, and intervals. |
| Numerical Axis | Adjust value axis scale, formatting, and log scale. |
| Series | Control bubble fill color, border, opacity, and symbol style. |
| Tooltip | Tooltip content, format, and triggers. |
| Others | Set Orientation (Horizontal / Vertical), and bubble size range (min & max). |
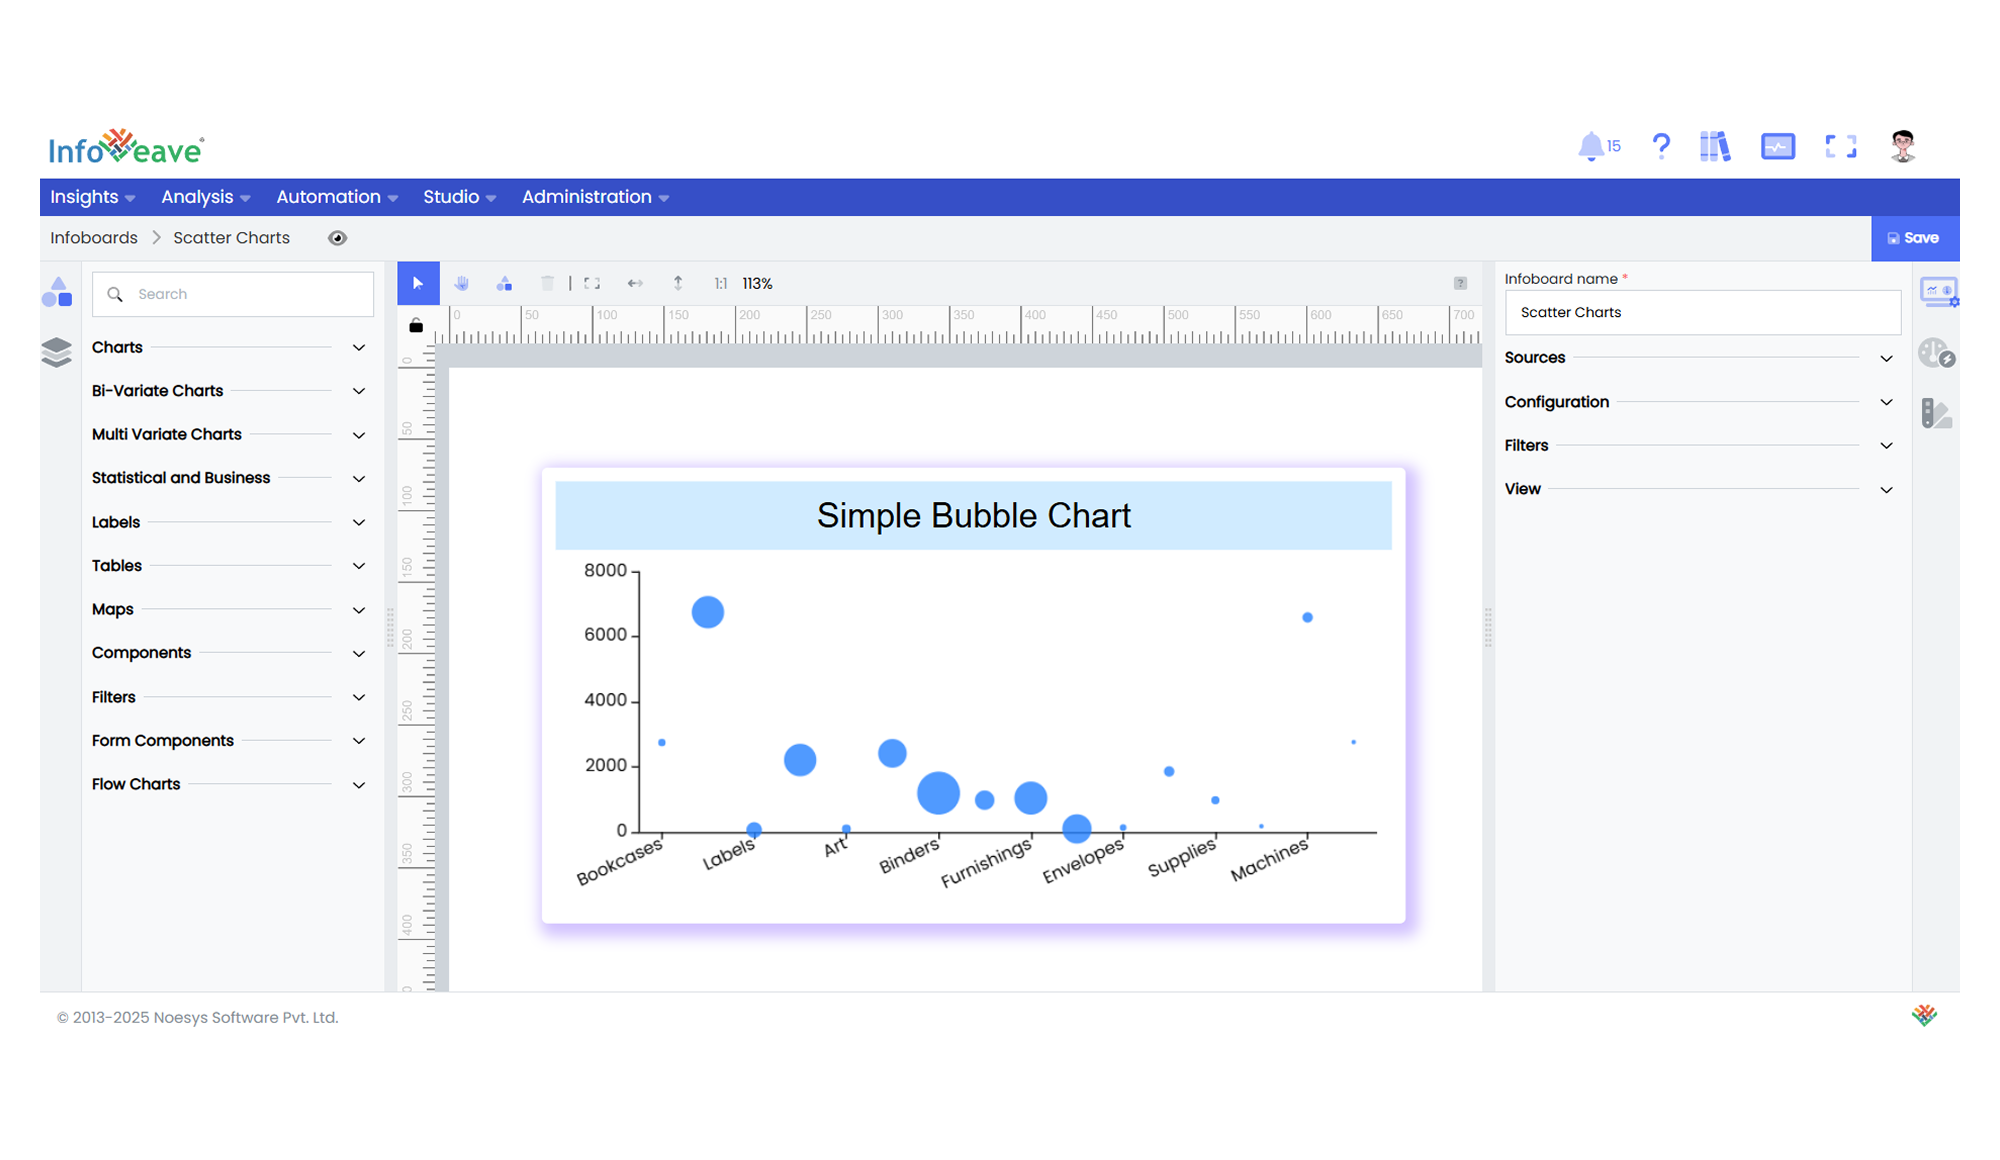
📊 Example Visualization